


Ethanol Prices Drive Corn Prices, Right?
The impact of the boom in ethanol production on corn prices has been the subject of an intense debate since 2006. It is no easy feat to separate out the impact of ethanol production from other factors, such as weather problems during the U.S. growing season and general economic growth. Fortunately, some very good studies have appeared recently and they demonstrate that rising ethanol production was indeed one of the main factors (but not the only one) responsible for the rise in corn prices since 2006. For example, Professors Carter, Rausser, and Smith estimate that the price of corn between 2006 and 2012 was 34 percent higher than otherwise would have been the case because of rising ethanol production. Other studies show higher or lower percentages but the main conclusion remains. We now also know that energy and corn markets have become directly linked through the ethanol channel. Based on this evidence, it is commonplace to argue that ethanol prices have largely driven corn prices since the start of the ethanol boom. This is not to say that other factors have not also been important at times, such as weather, but, rather, that ethanol prices have consistently been the most important driver of corn prices at the margin since 2006.
The purpose of today’s post is to demonstrate how conventional wisdom regarding the direction of causality between ethanol and corn prices has been turned on its head recently. The starting point is the simplified model of ethanol demand shown in Figure 1 that has been used in several farmdoc daily posts to analyze the market impact of RFS mandates and RINs pricing (see here and here for examples). The model has a vertical (perfectly inelastic) segment at 5 billion gallons in order to represent the demand for ethanol as an MTBE oxygenate replacement. It is vertical since non-ethanol alternatives are prohibitively expensive. The demand curve then becomes flat (perfectly elastic) for ethanol prices equal to 110 percent of CBOB gasoline prices between 5 and 13 billion gallons. This breakeven point reflects Department of Energy research on the value of ethanol as an octane enhancer in gasoline blends. The demand curve becomes vertical again to reflect the E10 blendwall, which is assumed here to be 13 billion gallons. The price of CBOB in this particular example is assumed to be $2.60 per gallon, close to the current price. The resulting breakeven ethanol price is then about $2.90 (1.10 X 2.60). If the price of CBOB changes the middle horizontal segment of the demand curve will shift up and down. Finally, the ethanol price in this example is $1.70, which is near present levels for nearby ethanol futures. Current spot prices for ethanol are actually somewhat higher as the market continues to transition from an inverted pricing structure to a more normal positive carry structure. Regardless, profit margins for blending ethanol with gasoline are quite high at the present time.
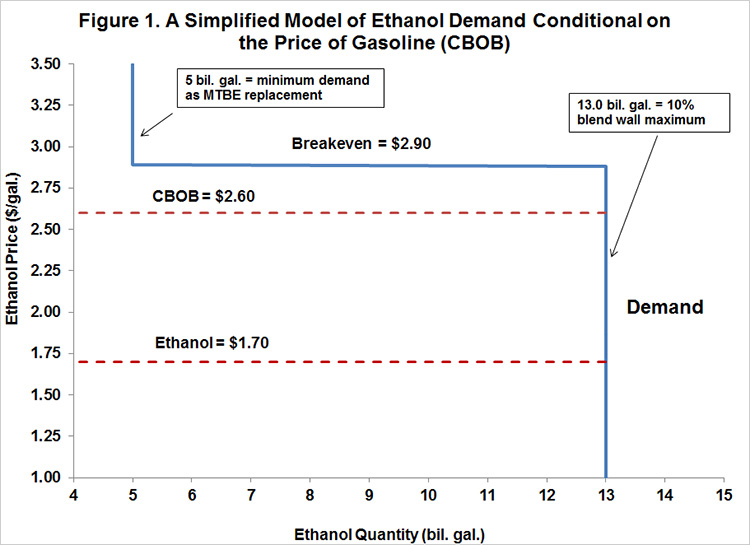
Figure 2 simply adds an ethanol supply function to the demand function presented in Figure 1. The supply function assumes the typical continuous positive relationship between ethanol price and quantity produced (absent trade), all other factors constant. It is assumed, however, that ethanol supply in the short run cannot exceed production capacity of about 15 billion gallons, which is reflected by the vertical segment of the supply curve. The intersection of the supply and demand curves determines the equilibrium price and quantity of ethanol blended, as noted, about $1.70 per gallon recently. We next note that the primary shifter of the supply function is the price of corn because corn is the most important input cost associated with ethanol production in the U.S. The plant model used in previous posts on ethanol profitability indicates that the cost of corn represents about 80 percent of total variable costs of ethanol production. At higher corn prices (all other factors unchanged), less ethanol would be supplied at each price of ethanol, shifting the supple curve to the left. Similarly, lower corn prices would shift the supply function to the right. These scenarios are presented in Figure 3 (eliminating the vertical segments of the supply curves for ease of exposition).

The model in Figure 3 shows that the equilibrium quantity of ethanol produced and blended is unchanged for a wide range of shifts in the supply curve. In this particular example, the equilibrium quantity of ethanol is stuck at the E10 blendwall for all shifts in the supply curve that result in an ethanol price less than $2.90 per gallon. If one assumes that shifts in the supply curve of ethanol are solely due to the changing price of corn, then, up to an ethanol price of $2.90, the price of corn completely determines the price of ethanol. In other words, the price of corn drives the price of ethanol, not the other way around. This is actually quite logical since the amount of ethanol used is essentially fixed; consequently, something else must be driving the price of ethanol.

Implications
The E10 blendwall not only has profound implications for the implementation of RFS mandates, but also for market price relationships. As long as the E10 blendwall is binding, the price of corn drives the price of ethanol. This is a reversal of the relationship between ethanol and corn prices that has been in place for much of the ethanol boom. It has the further implication that the pricing of corn at the margin is now primarily determined in the domestic and foreign feed grain markets. In this sense, it is “back to the future” for the corn market until the E10 blendwall is breached.
Disclaimer: We request all readers, electronic media and others follow our citation guidelines when re-posting articles from farmdoc daily. Guidelines are available here. The farmdoc daily website falls under University of Illinois copyright and intellectual property rights. For a detailed statement, please see the University of Illinois Copyright Information and Policies here.