


An Updated Look at the Profitability of Ethanol Production
It is no surprise to readers of farmdoc daily that ethanol production has played a major role in the grain price boom since 2006. Increasing ethanol production has been driven by a combination of market incentives and biofuels polices. Given the prominence of ethanol production it is important to track the profitability of the industry in order to assess likely ethanol production trends and potential impacts on grain market supply, demand, and prices.
We have been using a model of a representative Iowa ethanol plant the last several years to track the profitability of ethanol production. The model is meant to be representative of an “average” ethanol plant constructed since 2006. There is certainly substantial variation in capacity and production efficiency across the industry and this should be kept in mind when viewing profit estimates from the model. Some of the original assumptions include:
- 100 million gallon annual ethanol production capacity
- Plant construction costs of $2.11 per gallon of ethanol production capacity
- 40% debt and 60% equity financing
- 8.25% interest on 10-year loan for debt financing
- A total of $0.60 fixed costs per bushel of corn processed.
Other assumptions have been updated or added to the model:
- Non-corn and non-natural gas variable costs of $0.61 per bushel of corn processed in 2012 (higher in previous years)
- 2.80 gallons of ethanol (including denaturant) produced per bushel of corn processed
- 16 pounds of dried distillers grain (DDGS) produced per bushel of corn processed
- 0.55 pounds of corn oil per bushel of corn processed (starting in January 2012)
- Netback (marketing) costs of $0.05 per gallon of ethanol and $4 per ton of DDGS.
The main change in the model since our last post on ethanol profitability is the addition of corn oil revenue and netback costs. The updated assumption are based on a 2012 ethanol plant benchmarking study by Christianson and Associates. We appreciate this firm sharing the results of their study with us.
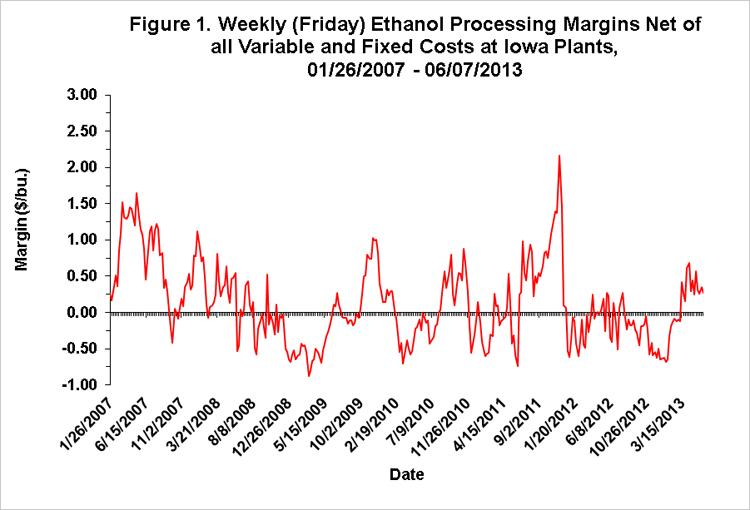
To track plant profitability over time, weekly ethanol and DDGS prices at Iowa ethanol plants were collected starting in late January 2007. Crude corn oil prices for the Midwest are available from OPIS. Natural gas costs are estimated based on monthly data from the EIA as available and updated using natural gas futures prices. Figure 1 presents the (pre-tax) estimates of ethanol processing margins based on the prices and model assumptions. Over the entire time period, margins net of variable and fixed costs averaged $0.12 per bushel of corn processed, but with enormous variability. There have been basically three periods in terms of net margins: i) high margins from 2007 through mid-2008, ii) breakeven margins from mid-2008 through the end of 2011, and iii) negative margins for 2012 through spring 2013. High corn prices as a result of the drought of 2012 obviously put considerable pressure on ethanol profitability. Positive margins reappeared in the latest three months of 2013, with margins averaging a healthy $0.37 per bushel. This has largely been driven by a jump in ethanol prices during this time period.
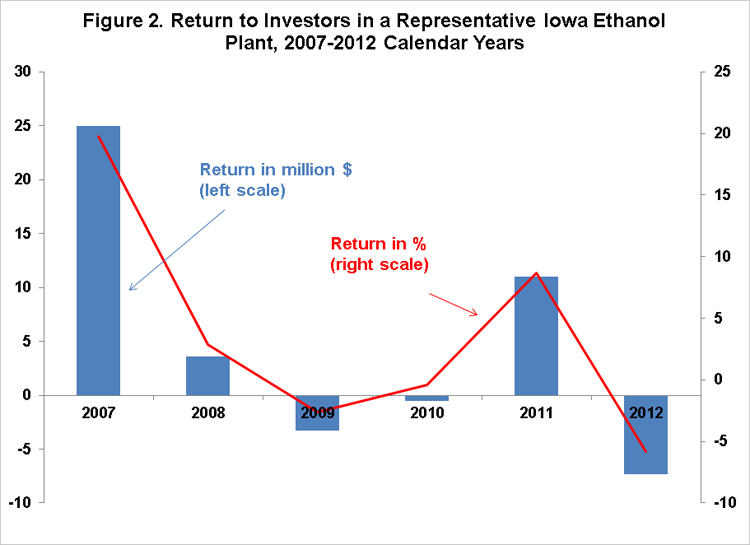
It is helpful to aggregate the profit margins over an annual horizon in order to see broader trends in estimated ethanol plant profitability. Figure 2 shows total annual profits net of variable and fixed costs for each year between 2007 and 2012. Profits are presented in terms of both total dollar returns to equity holders and percent return to equity. Profits were clearly highest in 2007 at $25 million. 2011 was next highest at $11 million. Lowest profits occurred in 2012 with a loss of $7.4 million. Averages for the six years were $4.7 million and 3.7 percent, respectively. Three of the six years had losses, all since 2007.
Conclusions
After starting out the recent boom period with strong profits, ethanol plants have struggled to maintain profitability. It is not clear whether the recent 3 month period of positive margins will be maintained going forward. A case can be made for some optimism given the possibility of lower corn prices in the upcoming marketing year and pressures for increasing volumes of ethanol to meet the rising mandate for renewable fuels under the RFS. Another extended period of red ink like 2012 does not appear to be in the cards.
Disclaimer: We request all readers, electronic media and others follow our citation guidelines when re-posting articles from farmdoc daily. Guidelines are available here. The farmdoc daily website falls under University of Illinois copyright and intellectual property rights. For a detailed statement, please see the University of Illinois Copyright Information and Policies here.