


Evaluating the Historical Variability of Corn’s Market Year Average Price and Projecting Price Loss Coverage Payments
Market Year Average (MYA) prices enter into payment calculations for Price Loss Coverage (PLC) and Agricultural Risk Coverage (ARC), two commodity program alternatives available in the 2013 Farm Bill (see here for more details). The distribution of MYA prices will influence payment levels under both programs. Hence, quantifying the potential MYA price distributions is important for evaluating choices between commodity programs. Moreover, quantifying MYA price distribution aids in understanding price risk farmers face. Herein, the distribution of MYA corn prices is quantified based on historical price variability. Based on this distribution, PLC payment rates are estimated.
Market Year Average Prices
Figure 1 shows Market Year Average (MYA) prices from 1947 through 2013. These prices represent cash prices received by U.S. farmers. They are calculated by the National Agricultural Statistical Service (NASS), an agency of the U.S Department of Agriculture. Since 1985, the MYA price for corn represents the quantity-weighted average of prices received from September through August. As a result, the 2013 MYA price of $4.65 shown in Figure 1 is a projection, as the 2013 marketing year has not come to an end.

The distribution of MYA price is estimated based on a three step procedure. First, stable price periods are identified and price means are calculated for each period. During these stable periods, prices varied but did not trend up or down. Second, yearly price deviations from those period means are computed, yielding price deviations for each year. Third, a future price distribution is projected based on these historical price deviations using a projection for the future MYA price. This procedure is applied to corn in the following three sections.
Periods of Corn Prices
Price periods since World War II are largely associated with changes in demand. There was a period of relatively stable prices from 1947 through 1972 in which prices did not trend up or down, but exhibited variability around a mean of $1.28 per bushel. This period of non-trending prices ended in 1972.
In the early 1970s, exports of corn increased, leading to a higher corn price level. From 1973 through 2005, MYA corn prices averaged $2.36 per bushel. Similar to the 1947-1972 period, prices did not trend up or down between 1973 and 2005, but exhibited variability around the $2.36 per bushel mean.
Use of corn in producing ethanol led to a new higher price level in the mid-2000s. From 2006 through 2013, the MYA price has averaged $4.72 per bushel.
Measuring Price Variability
Price variability is measured relative to the period means. For example, the 2012 MYA price of $6.90 is divided by the 2006-2013 period mean of $4.72 to arrive at a price deviation of 1.46. The 1.46 indicates that the 2012 price is 46% higher than the $4.72 mean. Prices deviations are calculated for each year, using the 1947-1972 mean of $1.28 for the years from 1947 through 1972, the 1973-2005 mean of $2.36 for the years from 1973 through 2005, and the 2006-2013 mean of $4.72 for the years since 2006.
Figure 2 shows annual price deviations from the mean price of the period. Recent years have been above the mean: 1.10 in 2010, 1.32 in 2011, and 1.46 in 2012. The 2013 projected MYA price of $4.65 is 0.98 of the mean, meaning that the 2013 price is 2% below the $4.72 average. Other periods of above mean prices are the early 1980s (1.32 in 1980, 1.06 in 1981, 1.08 in 1982, 1.36 in 1983, and 1.11 in 1984) and the mid-1990s (1.37 in 1995, 1.15 in 1996, and 1.03 in 1997).
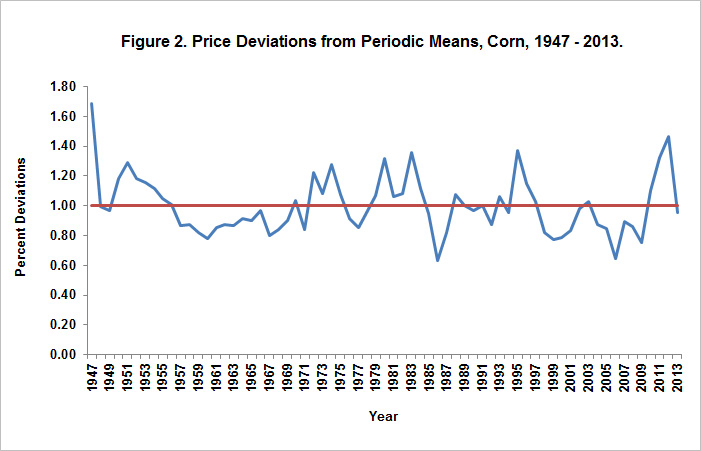
There are several notable periods when prices persisted below the mean for the period. The mid-1980s was a period of financial stress: The price deviation was 0.85 in 1985, 0.64 in 1986, and 0.82 in 1987. The late 1990s and early 2000s also were a period of below average prices: 0.82 in 1998, 0.77 in 1999, 0.78 in 2000, and 0.83 in 2001.
Developing the MYA Price Distribution
The price deviations calculated above are used to develop a projected distribution of MYA prices based on a projected mean MYA price. This mean represents the new period mean since 2006. While a new higher plateau likely has been achieved, the exact level of this mean is not known. The $4.72 mean since 2006 may be too high, as it is based on few price observations and does not include a “low” price period. It does seem reasonable to believe that the new mean is in the mid-$4.00 per bushel range. The increase in means occurring in the early 1970s was an 84% increase ($2.36 / $1.28 – 1). A similar increase in 2006 would result in a new mean price of $4.34. Current prices on Chicago Mercantile Exchange future prices suggest prices in the mid to high $4.00 range for the foreseeable future. A $4.50 price is used here. This price is consistent with earlier projections of average prices in the current price era developed by Irwin and Good (see here for more details).
The $4.50 price differs from other projections, some of which have been considerably lower than the $4.50 price. For example, USDA long-term baseline released in February 2014 has corn MYA prices below $4.00 for the 2014 through 2021 marketing years (see here for more details). While prices below $4.00 can and will likely occur, a sustained period with MYA prices below $4.00 for several years seems unlikely. In any case, as illustrated below, differing prices could be used to develop the MYA distribution, resulting in differing calculations of PLC payments.
The $4.50 mean is multiplied by each of the yearly price deviations since 1947 to arrive at a projected distribution of MYA prices. For example, the 2012 deviation of 1.46 is multiplied by the $4.50 mean to arrive at a $6.57 price ($4.50 x 1.46). In the construction of the price distribution in Figure 3, a $6.57 price is assumed to occur with a 1.5% chance (1.5% equals one divided by 67, the number of years for which price deviations are calculated).
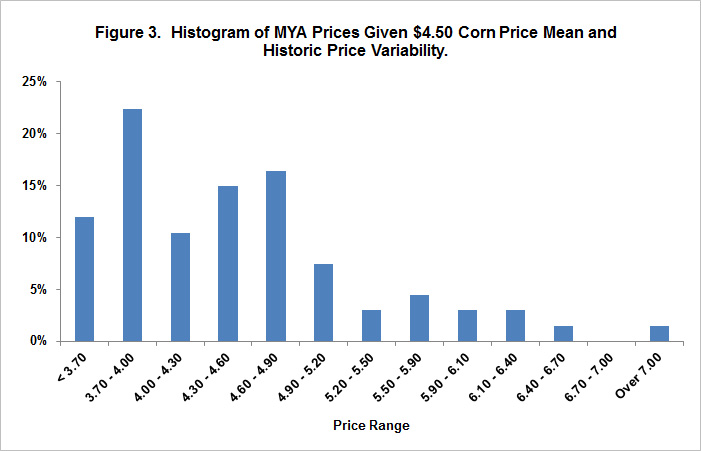
Figure 3 shows the resulting projected price distribution. Historical prices suggest a great deal of price variability moving forward, with a wide range and chances of both high and low prices. There is a 12% chance of a price below the $3.70, the reference price below which PLC payments will occur for corn.
Projected PLC payments
Projected PLC payments are estimated using the price distribution illustrated in Figure 3. When a price is below $3.70, a PLC payment rate is calculated as $3.70 minus the MYA price, with the result multiplied by .85. The .85 factor represents the fact that PLC payments will be paid on 85% of base acres. The PLC payment rate is averaged over all observations, including those that are zero.
With a mean of $4.50, the price distribution in Figure 3 indicates a 12% chance of a PLC payment. The PLC payment rate is $.033 per bushel. A farm having a 145 bushel base yield, close to the average for central Illinois, has an average PLC payment of $4.79 per base acre.
Different means will impact the probability of payment and PLC rate:
- A $3.50 MYA price will have a 66% chance of payment and a $.326 PLC rate.
- A $3.75 MYA price will have a 54% chance of payment and a $.214 PLC rate.
- A $4.00 MYA price will have a 42% chance of payment and a $.130 PLC rate.
- A $4.25 MYA price will have a 28% chance of payment and a $.066 PLC rate.
- A $4.50 MYA price will have a 12% chance of payment and a $.033 PLC rate.
- A $4.75 MYA price will have a 6% chance of payment and a $.018 PLC rate.
Commentary
For any assumed level of MYA price mean, the above methodology for estimating MYA price distributions and PLC rates are based on two important assumptions. The first is that there is a period of relative price stability occurring now similar to those that have occurred in the past. If there is a price regime change, either higher or lower, the above distributions are not valid. The second is that the historic price variability serves as an indicator of price variability in the future. If price variability is higher than previous variability, then PLC payment rates would be lower, and vice versa.
When evaluating PLC payment estimates, understanding the assumptions used to estimate payments are critical. Key assumptions are:
- The expected average MYA price used to generate payments. Higher prices will result in lower payments, and vice versa.
- The magnitude of price variability. Price variability larger than historical variations will result in larger PLC payments, and vice versa.
- The distribution of MYA prices. The above approach is a non-parametric approach. Other approaches may fit a distribution to the price deviations, thereby smoothing out the probability. The parametric assumption used to fit the distribution matters. Symmetric distributions (i.e., normal) will result in higher payments than those shown here. Skewed distribution and those allowing fat tails (e.g., log-normal, extreme) will come close to the estimates provided here.
MYA prices are time dependent, next year’s price is correlated to this year’s price (see here for a discussion). This factor is not taken into consideration in estimated payments shown above.
Summary
Historical price variability is used to estimate price distributions for future MYA corn prices. A reasonable estimate of the mean MYA price for corn is $4.50 per bushel. Given historical variability and a $4.50 mean, PLC payments are estimated to occur in 9% of the years and have a rate of $.033 per base bushel. Estimates of PLC payments increase with lower mean prices and variability higher than historical variability.
The above distribution can be used to estimate ARC payments; however, ARC payment estimates require county yield information as well as price information. Future efforts will evaluate these distributions.
Disclaimer: We request all readers, electronic media and others follow our citation guidelines when re-posting articles from farmdoc daily. Guidelines are available here. The farmdoc daily website falls under University of Illinois copyright and intellectual property rights. For a detailed statement, please see the University of Illinois Copyright Information and Policies here.