


The New Era of Crop Prices — A Five-Year Review
In a 2008 report and a 2009 article we addressed whether the trend towards higher crop prices that started in the Fall of 2006 was here to stay. Our analysis was motivated by the need of farmers, landowners, and others in the agricultural industry to have some reasonable way of assessing long-term price prospects. From a farmer’s standpoint, the question basically came down to this, “What is a good price for corn, soybeans and wheat?” We argued that corn, soybean, and wheat prices moved to a new, higher nominal price level beginning in about December 2006. We suggested that the new price level would persist for an extended period of time and we projected the likely average Illinois monthly price and range in monthly prices for those commodities in the first five years of new era. Based on average monthly prices through February 2011, we evaluated the accuracy of those projections in a post on March 29, 2011. The projection of the expected distribution of monthly average prices was presented in a post on November 18, 2011. Here, we briefly review the methodology for projecting the average monthly prices, the range in monthly prices, and the distribution of monthly prices and then provide an evaluation of those projections based on average monthly prices in Illinois for the 73-month period from December 2006 through December 2012. The prices used are those reported by the USDA’s National Agricultural Statistics Service in the monthly Agricultural Prices report.
Average Monthly Prices and Price Ranges
The projection of average monthly prices in the new era was centered on corn since it was believed that the new era of prices that began in late 2006 was associated with the rapid expansion in biofuels (ethanol) production and the impact on corn demand. The analysis began with the identification of two previous price eras for corn and the change in average price between those two periods. The first era was the post-war period that extended from January 1947 through December 1972 when the average monthly corn price in Illinois was $1.28 per bushel. The second period, associated with the rapid increase in corn export demand in 1973, extended from January 1973 through November 2006 when the average monthly price of corn was $2.42. The projection of the average price in the new era made the simple assumption of an equal percentage price change from the previous era that occurred between the previous two eras. The average price projection of $4.60, then, was calculated as [($2.42/$1.28) X $2.42]= $4.60. The average price of soybeans was based on an expected ratio of soybean to corn prices of 2.3, resulting in a projection of $10.58. Likewise, the average price of wheat was based on an expected ratio of wheat to corn prices of 1.26, resulting in a projection of $5.80.
The projections of the ranges in the average monthly prices during the first five years of the new price era was based on the ranges actually experienced during the first five years of the previous two eras. The lowest and highest average monthly prices during the first five years of each era was calculated as a percentage of the average price for the entire period. The percentages were averaged for the two periods and the average was used to project the range in monthly prices in the new era.
Table 1 summarizes the projections of average prices and price ranges for the three crops for the new era that began in December 2006 along with actual averages and ranges from December 2006 through December 2012. Average monthly prices in the first 73 months of the new price era were close to projections for corn and wheat. Ranges in average monthly prices were also close to projections for wheat, but the highest average monthly corn price (August 2012) exceeded the projection by $0.88. Soybean prices have deviated most from projections, with the average exceeding the projection by $0.53 and the lowest and highest average monthly prices both lower than projected.

Distribution of Average Monthly Prices
To develop expected distributions of monthly average prices we started with the calculation of the percentage deviations of monthly farm prices received in Illinois from the average price in the previous era. For example, the average (nominal) price of corn in the previous era (January 1973-September 2006) was $2.42 and the price in January 1981 was $3.20, or 32 percent higher than the average for the era. The expected average price for the new era is $4.60. We can then state an equivalent percentage deviation to the January 1981 price for the new era as 4.60 X 1.32 = 6.07. In other words $6.70 represents the equivalent 32 percent deviation above the average price for the new era as $3.20 does for the previous era. We did this same calculation for every month for corn, soybeans, and wheat over January 1973-September 2006 to simulate the variability of prices we expect in the new era. The expected distributions of monthly average prices are presented in Figures 1, 2, and 3.


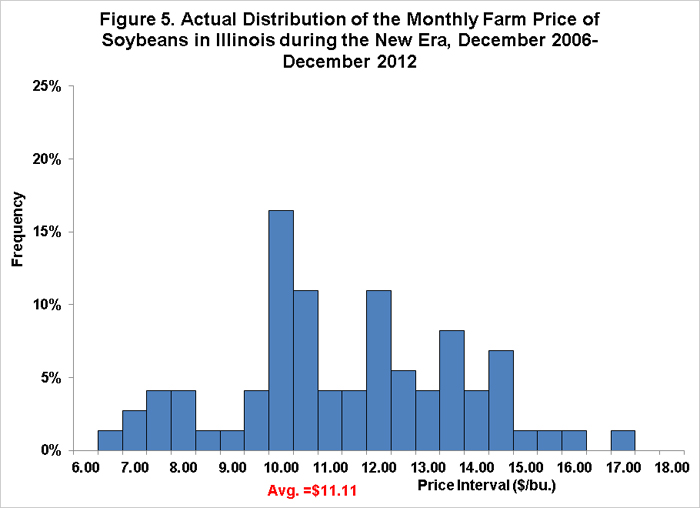
Based on monthly average prices from December 2006 through December 2012, the actual distributions of prices so far in the new era are shown in Figures 4,5, and 6. Several observations can be made about the actual distributions of average monthly prices relative to the projected distributions. For corn, the frequency of prices in both the upper end and lower end of the price range has been larger than projected. The highest frequency of average monthly average prices has been in the $3.25 to $4.00 range. Most of those prices occurred in the first two years of the new era and again in 2009. For soybeans, the actual distribution of prices has been more similar to the projected distribution than for corn, but with a wider range and higher overall average than projected. The price distribution for wheat has tended to be bi-modal, with the highest frequencies in the $3.75 to $4.75 and $6.00 to $6.75 ranges.


Conclusions
Despite some differences between projections and actuals, the new era projections for the price of corn, soybeans, and wheat that we made almost five years ago have held up remarkably well. While the approach is certainly simple, it appears to provide robust expectations for crop prices in this new era. Tomorrow, we will use the actual Illinois monthly average prices of corn, soybeans, and wheat for December 2006 through December 2012 to evaluate whether the original projections of average prices and price distributions in the new era need any modifications. We will also use the new era projections to evaluate the current level of prices in these markets and draw implications for marketing 2012 and 2013 crops.
Disclaimer: We request all readers, electronic media and others follow our citation guidelines when re-posting articles from farmdoc daily. Guidelines are available here. The farmdoc daily website falls under University of Illinois copyright and intellectual property rights. For a detailed statement, please see the University of Illinois Copyright Information and Policies here.