


Possible Crop Revenues for Corn in McLean County, Illinois
In this article, possible 2016 crop revenues are estimated for McLean County, Illinois. The expected 2016 crop revenue is $689 per acre, $189 per acre lower than the average revenue from 2010 through 2014. There is a 30% chance of crop revenue being less than $600 per acre.
Approach
Crop revenue is based on county yields and harvest prices, resulting in the same revenue as used to calculate payments under Area Risk Plan. Because county yields are used, the results show variability for a county, which tends to be less variable than revenue for a farm.
The approach for generating possible yields and prices uses historical yields and prices from 1972 to 2014. The historical data is shown in Table 1 under the heading “historical outcomes”. In this approach, there are 43 possible yield and price combinations, one for each year in the historical period. The approach will maintain the correlation between yield and price changes, but the levels will reflect 2016 conditions.
Harvest prices are used to calculate revenue when determining crop insurance payments. These prices are estimated based on a $3.80 projected price, roughly the current level of the December 2016 Chicago Mercantile Exchange (CME) corn contract. The 2016 possible harvest prices equal percent changes in historical prices times the $3.80 price. Take 1972 as an example having a projected and harvest prices of $1.24 and $1.35, respectively (see Table 1). The 1972 harvest price is 8.9% higher than the 1972 projected price (.089 = 1.35 / 1.24 – 1). The possible price associated with 1972 is $4.25 ($3.98 projected price x (1 + .089)). Harvest prices resulting from these prices are shown in the sixth column of Table 1. Further discussion of possible harvest prices for 2016 is provided in the January 5th farmdoc daily article.
Possible 2016 yields reflect increases in yields over time. A trend line is fit to yields from 1972 through 2014 using linear regression: -3,515 + 1.836 x year. Given this equation, the 2016 trend yield is 186 bushels per acre (-3,515 + 1.836 x 2016), representing the expected yield for McLean County for 2016. If 2016 could be repeated a large number of times, the average likely would be close to 186 bushels per acre. Yield differences for each year are calculated and are used to adjust from the trend yield. In 1972, for example, the actual yield is 126 bushels per acre and the 1972 trend yield is 106 bushels per acre (106 = -3,515 + 1.836 x 1972). The 1972 trend yield is 20 bushels higher than the trend yield (20 = 126 actual yield – 106 trend yield), giving an estimate of yield of 206 bushels per acre (186 trend yield + 20 difference in 1972). This 206 per bushel yield represents a 2016 yield given 2016 technology, but given 1972 weather and market conditions. The yields generated through this process are shown in the seventh column of Table 1.

County revenue equal county yield times harvest price, as shown in the eighth column of Table 1. The average of these possible revenues is $689 per acre. This average is below crop revenues from 2010 to 2014: $927 in 2010, $1,011 in 2011, $825 in 2012, $830 in 2013, and $761 in 2014 (see Table 1).
Yield – Price Combinations
Possible yield and price combinations from Table 1 are shown as dots in Figure 1. Several of the yield-price combinations are denoted by the year generating that combination. For example, the two lowest yields are associated with 1988 and 2012, drought years. In both years, harvest price was higher than the expected price. The year with the highest possible harvest price of $6.73 per bushel is 1973. A year like 2014 would result in yield of 221 per acre, and a harvest price of $2.87 per bushel (see Figure 1).

In Figure 1, the black vertical line is at $3.80 per bushel, the projected price used to generate the possible harvest prices. The black horizontal line is associated with the expected yield of 186 bushels per acre. These black lines divide the graph in quadrants:
- Lower yield – higher price: Eleven of the observation fall into this quadrant, suggesting that 26% of the time a lower yield and higher price will result.
- Lower yield – lower price: Seven of the observations fall into this quadrant, suggesting that 16% of the time a lower yield and higher price will result.
- Higher yield – higher price: Seven of the observations fall into this quadrant, suggesting that 16% of the time a higher yield and higher price will result
- Higher yield – lower price: Eighteen of the combinations fall into this quadrant, suggestion that 42% of the time a higher yield and lower price will result.
Note the negative correlation between yields and prices results in more yield-price combinations in the “higher yield – lower price” and “lower yield – higher price” quadrants than in the other two quadrants. McLean County is in central Illinois, an area where large amounts of corn are grown. Above-trend yields in this area tend to result in higher aggregate supply, leading to lower prices. The opposite dynamic works as well: below-trend yields lead to lower aggregate supply and higher prices.
Further note that the largest number of observations falls into the “higher yield – lower price” quadrant, suggesting that yield often is above trend and results in a lower price. Above trend yields and harvest prices lower than projected prices occurred 42% of the time between 1972 and 2014. Stated alternatively, nearly 50% of the time yields are above trend and prices will be below the projected price. Unfortunately, this quadrant does not result in the highest crop revenues.
Range of Possible Crop Revenues
Figure 2 shows the same yield – price pairs as in Figure 1. Lines in Figure 2 represent revenue levels of $600, $700, $800, and $900 per acre. Take the line for $600 per acre. Any yield-price combination above the line has crop revenue above $600 per acre while combinations below the line have revenue less than $600 per acre. There are 13 of the yield-price combination below $600, indicating that there is roughly a 30% chance of crop revenue being less than $600 per acre. These combinations imply:
- a 30% chance of crop revenue less than $600 per acre,
- a 37% change of revenue between $600 and $700 per acre,
- a 17% chance of revenue between $700 and $800 per acre,
- a 9% chance of revenue between $800 and $900 per acre, and
- a 7% chance of revenue over $900 per acre.
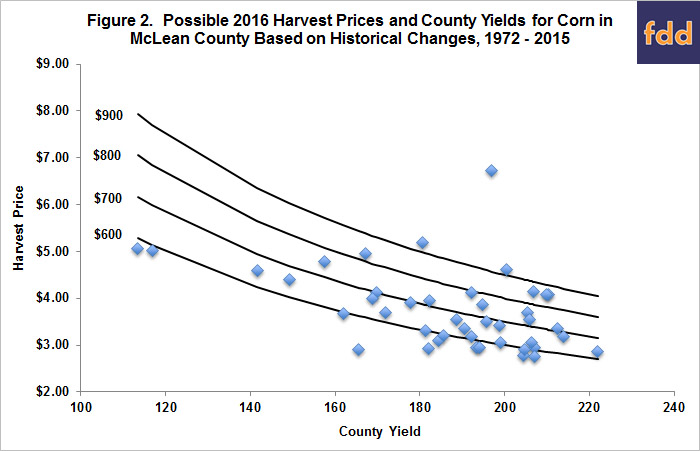
These are higher chances of low revenues compared to recent years. Crop revenue in McLean County was over $800 in each year from 2010 to 2013. This historical analysis would suggest that the chance of revenue above $800 is about 16%.
Commentary
The expected level of crop revenue in McLean County is projected at $689 per acre, $182 per acre lower than the average level from 2010 through 2013. Overall, crop revenue is projected lower in 2016. There also is a risk of much lower crop revenues, with a 30% chance of crop revenues being below $600 per acre. Higher levels are possible as well. However, historical changes in yield and prices suggest only a 15% chance or revenues above $800 per acre, the level of crop revenue from 2010 to 2013.
Yields and prices that result in crop revenue below $600 per acre likely would result in some form of crop insurance and ARC payments. Hence, the crop revenues in this article do not give the complete picture on gross revenue. Having said that, one should expect 2016 gross revenues to be below those from 2010 to 2013.
References
Schnitkey, G. "Possible 2016 Harvest Prices for Corn." farmdoc daily (6):2, Department of Agricultural and Consumer Economics, University of Illinois at Urbana-Champaign, January 5, 2016.
Disclaimer: We request all readers, electronic media and others follow our citation guidelines when re-posting articles from farmdoc daily. Guidelines are available here. The farmdoc daily website falls under University of Illinois copyright and intellectual property rights. For a detailed statement, please see the University of Illinois Copyright Information and Policies here.