Averages and Seasonality of Prices for Nitrogen Fertilizers
From 2009 through 2015, anhydrous ammonia had an average price equal to $.45 per pound of actual nitrogen (N). This $.45 price was lower than the prices for urea ($.54 per pound) and liquid N ($.61 per pound). From 2009 through 2015, nitrogen prices averaged less in the fall than in the spring. Often, applying anhydrous ammonia in the fall is one of the lowest cost methods of placing nitrogen on fields. Benefits from a combination of higher yields or lower application rates need to be obtained to cause spring and early summer applications to be competitive with fall applications.
Anhydrous Ammonia Prices
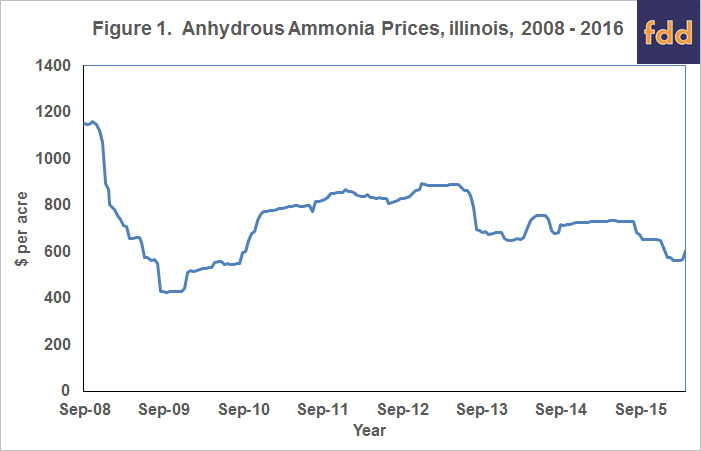
Prices used in this article are from the bi-weekly Illinois Production Cost Report, a publication of the Agricultural Marketing Service (AMS), an agency of the U.S. Department of Agriculture. AMS began reporting prices in September 2008. Since that starting point, anhydrous ammonia prices varied. The highest reported price of $1,161 per ton occurred on October 15, 2008. The lowest price of $431 per ton occurred during the fall of 2009. Over the entire period, prices averaged $733 per ton.

Since August 2015, ammonia prices have been on a declining trend until very recently. During the summer of 2015, ammonia prices averaged $730 per ton. From the $730 per ton level, ammonia price decreased to a low of $562 per ton in late February 2016. From the $562 level, ammonia prices increased to $605 per ton on March 31, 2016. Recent increases in ammonia prices may be partially caused by projected larger number of corn acres in 2016 (see farmdoc daily, April 4, 2016).
Ammonia, Urea, and Liquid N Prices
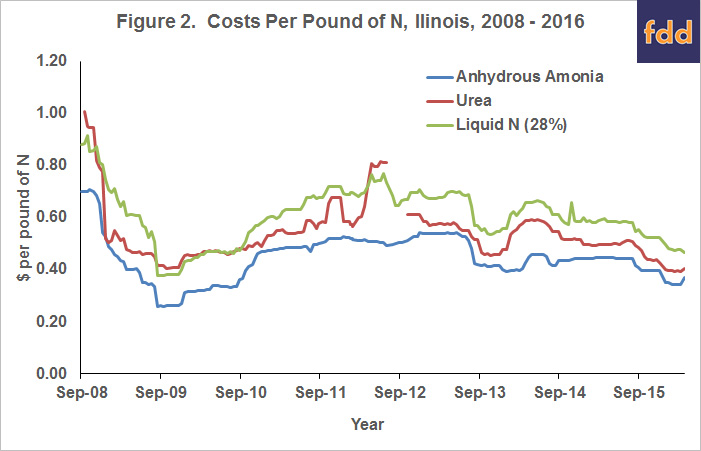
AMS also reports urea and liquid N prices. Figure 2 shows a time series of these nitrogen fertilizer prices stated on a per pound of N basis. Take, for example, an ammonia price of $733 per ton. A ton of ammonia contains 1,640 pounds of N. The $733 per ton ammonia price translates into .45 per pound of N (.45 = $605 price / 1,640 pounds of N). Since a ton of each fertilizer contains different N levels, making these adjustment places the prices of ammonia, urea, and liquid N on a more comparable basis.

Over time, these nitrogen prices followed each other closely. Ammonia and urea prices had a .81 correlation coefficient. Ammonia and liquid N had a .92 correlation coefficient.
Over the 2008-2016 period, anhydrous ammonia averaged $.45 per pound, urea averaged $.54 per pound, and liquid N averaged about $.61 per pound of N. Urea had an average price that was $.09 per pound higher than anhydrous ammonia. Liquid N had a $.16 per pound higher price than anhydrous ammonia. These are the expected price relationships: anhydrous ammonia price averaged less than urea and liquid N prices. Anhydrous ammonia often is used in the production of urea and liquid N. The transformation from anhydrous ammonia adds costs to urea and liquid N.
The nitrogen recommendation from the Corn Nitrogen Rate Calculator for central Illinois is about 160 pounds per acre. If this recommendation level was provided entirely by ammonia at the 2008-2016 average price, nitrogen fertilizer costs would be $72 per acre (160 rate X .45 price). Providing the same nitrogen with urea increases costs by $14 per acre to $86 per acre (160 rate x $.54 price). Compared to anhydrous ammonia, using liquid N increases costs by $26 per acre to $98 per acre (160 rate X $.61 price). Using anhydrous ammonia has a significant cost advantage compared to urea and liquid N for applying the same level of nitrogen.
Currently, price differences between the nitrogen fertilizers are less than the historical spreads. On March 31, prices were $.37 per pound for ammonia, $.41 for urea, and $.47 for liquid N. Currently, urea has a $.04 higher price than anhydrous ammonia, compared to a $.09 historical average. Liquid N has a $.10 per pound higher price than anhydrous ammonia, compared to a $.16 average historical difference.
Seasonal Price Difference
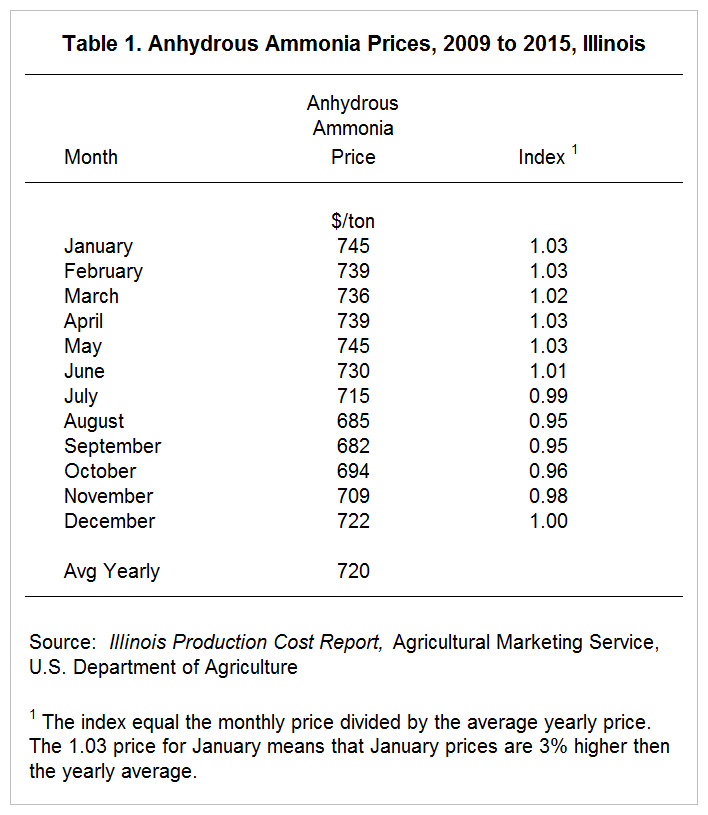
Seasonally, nitrogen fertilizer prices have been lower in the fall than during the spring. From 2009 to 2015, anhydrous ammonia prices averaged $720 per ton (slightly less than the $733 price reported above which included high 2008 prices). The September price averaged $682 per ton, 95% of the $720 yearly average price (see index column in Table 1). On the other hand, the May price of $745 per ton was 3% higher than the $720 per year). Note that there is considerable variability from year to year. Sometimes prices are lower in the spring than the fall.

Commentary
Fertilizer price trends illustrated in this article influence farmers’ fertilizer decisions. Fall application of anhydrous ammonia often are one of the lower cost methods of applying a set amount of nitrogen. Anhydrous ammonia typical is a lower cost fertilizer on a per pound of N basis. And, nitrogen prices tend to be lower in the fall.
Moving fertilizer applications to the spring an early summer likely increase the costs of providing a pound of N to the field. Higher seasonal prices during the spring have some impact on this increase. More importantly, nitrogen solutions likely become preferred to anhydrous ammonia in the spring due to timing and field considerations giving nitrogen solution applications advantages over ammonia applications. From an economic perspective, movement from fall to spring application likely requires yield increases, nitrogen rate reductions, or other benefits. Depending on the timing of the spring application, another benefit may be the reduction in cost from not applying a nitrogen loss inhibitor. Continued experimentation likely will find ways to increase the economic attractiveness of spring and summer nitrogen applications.
References
Good, D. "Weekly Outlook: Corn Consumption and Acreage." farmdoc daily (6):64, Department of Agricultural and Consumer Economics, University of Illinois at Urbana-Champaign, April 4, 2016.
Iowa State University, Agronomy Extension. Corn Nitrogen Rate Calculator. http://extension.agron.iastate.edu/soilfertility/nrate.aspx
USDA-IL Dept of Ag Market News Service. Illinois Production Cost Report (Bi-weekly). https://www.ams.usda.gov/mnreports/gx_gr210.txt
Disclaimer: We request all readers, electronic media and others follow our citation guidelines when re-posting articles from farmdoc daily. Guidelines are available here. The farmdoc daily website falls under University of Illinois copyright and intellectual property rights. For a detailed statement, please see the University of Illinois Copyright Information and Policies here.


