Why Crop Insurance Has Become an Issue
Introduction
Considerable debate surrounds the U.S. crop insurance program, including its cost, role in farm conservation, and impact on farm management and farmland values. Objective of this article is to examine the broader considerations that underpin these specific debates. Unless these broader considerations are addressed, crop insurance will likely remain a topic of debate well beyond the next farm bill.
Increasing Program Cost
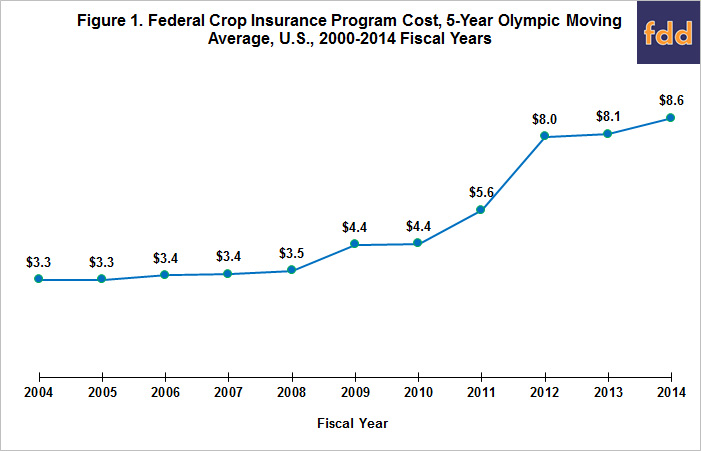
Cost to the U.S. government of its crop insurance program has increased from $3.3 billion in 2000-2004 to $8.6 billion in 2010-2014 (see Figure 1 and data note 1). Costs include the subsidy of insurance premiums, reimbursement of Administrative and Operation (A&O) costs incurred by private companies in delivering the insurance program, and government’s share of participating in underwriting gains and losses. Any large expenditure program growing fast will attract attention. Moreover, the growth in crop insurance cost occurred during a period of generally low financial stress among crop farms. This feature runs opposite to the counter-cyclical nature of most farm safety net programs since these programs began during the 1930s.

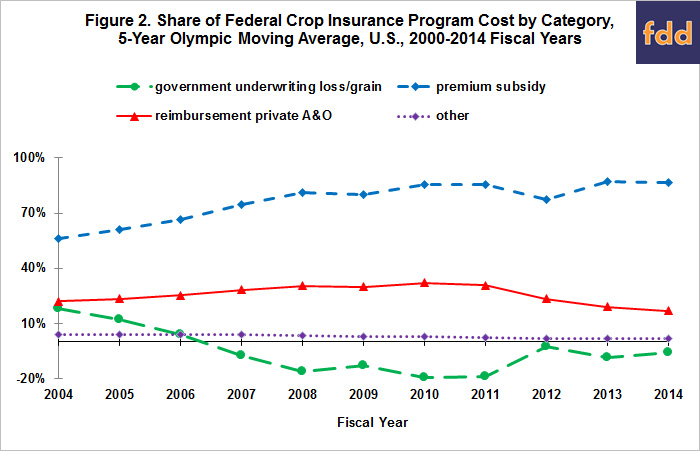
The increase in costs occurred even though the reimbursement rate for A&O was reduced and the reinsurance agreement, which affects the government’s underwriting losses and gains, was renegotiated. Share of total costs accounted for by these two cost components has declined since 2000 (see Figure 2). In contrast, the share of expenditures accounted for by the premium subsidy increased from 56% in 2000-2004 to 87% in 2010-2014.

History of Premium Subsidies
The Federal Crop Insurance Act of 1980 made numerous changes to the crop insurance program, which had existed since the 1930s as an experimental program. A 30% subsidy rate for crop insurance premiums was enacted, but the subsidy was limited to the dollar value when applied to the 65% coverage level. Over time Congress increased the premium subsidy rate at all coverage levels to encourage participation. Major changes in subsidy rates occurred in the Agricultural Risk Protection Act of 2000 and Food, Conservation, and Energy Act of 2008. As an example, the Agricultural Risk Protection Act of 2000 increased the subsidy rate for Crop Revenue Coverage insurance from 18% to 55% at 75% coverage.
Federal subsidies for crop insurance premiums did not consistently exceed $1 billion per year until 2000 (see Figure 3). They then increased by around 150% both before and during the period of farm prosperity. Because the per-acre value of a crop is a key determinant of premium subsidies, premiums subsidies will likely decline if prices continue to stay low. Besides per-acre crop value, other key determinants of premium subsidies are the premium subsidy rate set by Congress, the insurance products bought by farmers since subsidy rates vary by product, and changes in the rating of risk. For example, changes in per-acre crop value likely explain only a small part of the increase in premium subsidies that occurred through the 2006 crop year, or the beginning of farm prosperity.

Premium Subsidies and Program Performance
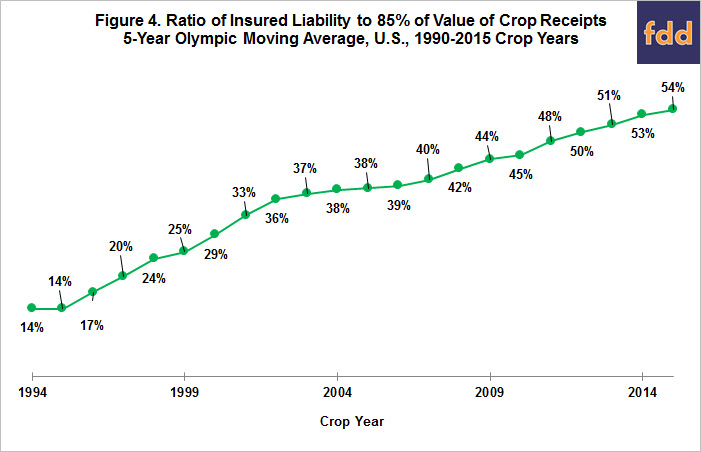
Consistent with Congressional intent to increase participation, insured liabilities as a share of 85% of the value of U.S. crop receipts increased from 16% during the early 1990s to 54% in recent years (see Figure 4). Crop receipts are multiplied by 85% because 85% is the highest coverage level for individual farm insurance, which is by far the most purchased insurance product. Both acres insured and average coverage level increased, the former from 90 million to 299 million and the latter from 66% to 75% between the early 1990s and 2015.

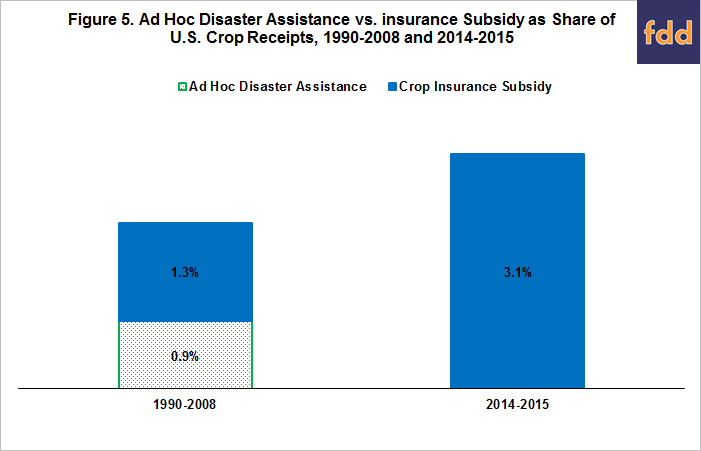
A rationale consistently given for enhancing participation in crop insurance was to reduce ad hoc crop disaster assistance. Ad hoc crop disaster assistance began in the mid-1970s after target price programs replaced price floor programs, and was enacted for almost every crop year through 2008 in which a non-trivial area of the U.S. experienced low yields. The 2008 farm bill authorized a so-called permanent crop disaster program, known by its acronym SURE. No ad hoc crop disaster program was enacted for the 2012 drought even though SURE had ended, and SURE was not authorized in the 2014 farm bill. Over the 1990-2008 period, spending on crop insurance premium subsidies averaged 1.3% of the value of U.S. crop receipts while spending on ad hoc crop disaster assistance averaged 0.9% (see Figure 5). During the 2014 and 2015 fiscal years, nothing was spent on ad hoc crop disaster assistance while premium subsidies averaged 3.1% of the value of crop receipts. Comparing the two periods, spending on ad hoc crop disaster assistance declined 0.9 percentage point but spending on premium subsidies increased 1.8 percentage points, or twice as much. (See data notes 2 and 3.) It should be noted that potential cost savings was only part of the argument for replacing ad hoc crop disaster assistance with crop insurance. Other key parts of the argument were the need for legislation on an on-going basis and the often difficult legislative negotiations about which geographic areas and crops should receive payments and how much payment they should receive.

The increase in crop insurance participation was achieved with an increasing premium subsidy cost, even when measured relative to insured liability. Average premium subsidy per dollar of insured liability steadily increased at least through the 2010 crop year (see Figure 6). This finding is not surprising. Low risk farmers are less likely to buy insurance since their risk is low. A higher subsidy rate is thus needed to induce them to buy insurance. However, the higher subsidy rate is made available to all farmers, regardless of their risk. (See data note 4.)

Concluding Observations
- Crop insurance has emerged as a continuing policy issue on the American Agenda.
- Crop insurance continues to successfully ward off attempts to cut spending, but each confrontation spends political capital and likely increases the ranks of critics. Discussions will continue until the reasons underlying the discussions are addressed.
- Crop insurance’s emergence as a policy issue reflects in part a large expenditure program whose spending has grown fast even during a time of crop farm prosperity.
- Premium subsidies account, by far, for the largest share of spending on crop insurance. Moreover, premium subsidy per dollar of insured liability has also increased. If society wants to reduce spending on crop insurance, it will eventually have to address premium subsidies.
- Federal spending on insurance premiums have evolved from a small to large expenditure item. Large expenditure items face different questions than small expenditure items. Simply put, for large expenditure items, benefit-cost assessment centers on society at large as much as program beneficiaries. “Whether money is better spent on another program society desires?” becomes a central question for no other reason than a large sum of money is involved. The implication is that supporters need to justify the program, not in terms of what it can do for program beneficiaries, but what the program can do for society.
- Prior to the late 1990s, crop insurance could succinctly be described as a government policy to assist farmers in times of stress resulting from yield shortfalls, usually from weather over which the farmer had little control. The non-agriculture public could easily understand and clearly relate to this story. However, yield insurance has morphed into revenue insurance which may now be morphing into margin insurance on the difference between gross revenue and some measure of cost. County insurance has morphed into shallow loss insurance (SCO) with cotton now having its own shallow loss program (STAX). Yield (AHP) exclusion and Harvest Price Option (HPO) are non-trivial add-ons. These changes have value to farmers and insurance companies and agents, but the story about what risk is being covered and how much farmers may or may not have control over these risks has become muddied and complex at best. Crop insurance supporters continue to create new products and add-ons rather than speak to the relevancy issues being raised by critics. From the political process perspective, the importance to a program of having a simple story to which the general public can related cannot be emphasized enough.
- The simple measure presented in Figure 5 calls into question whether crop insurance is cheaper than ad hoc crop disaster assistance.
- Crop insurance has another fundamental dilemma: there is no objective rationale for the current matrix of premium subsidy rates, either in total or by product and coverage level. The matrix of subsidy rates is a political equilibrium based on what society will pay. Lack of an objective basis for the rate of a subsidy is not an issue until a program becomes an issue. Failure to satisfactorily address the objective measurement question will ultimately lead to cuts and potential elimination of a program. The direct payment program confronted the same problem in terms of an objective basis for its payment rate per acre for a given crop. The failure of its supporters to address this question ultimately contributed to direct payments being eliminated in the 2014 farm bill. This issue of an objective based measure for the premium subsidy rate will be explored further in the next article in this series on why crop insurance has become an issue.
References
Council of Economic Advisors. Economic Report of the President. U.S. Government Publishing Office. Accessed April 2016. (U.S. Federal outlays) https://www.gpo.gov/fdsys/browse/collection.action?collectionCode=ERP
Shields, Dennis A. "Federal Crop Insurance: Background and Issues." Congressional Research Service CRS Report. December 13, 2010. http://adriansmith.house.gov/sites/adriansmith.house.gov/files/CRS%20-%20Crop%20Insurance.pdf
Shields, Dennis A. "Federal Crop Insurance: Background." Congressional Research Service CRS Report. August 13, 2015. https://www.fas.org/sgp/crs/misc/R40532.pdf
U.S. Department of Agriculture, Economic Research Service. Farm Income and Wealth Statistics. Updated February 9, 2016, and accessed April 20, 2016. http://www.ers.usda.gov/data-products/farm-income-and-wealth-statistics.aspx
U.S. Department of Agriculture, Economic, Statistics, and Market Information System. Agricultural Outlook. CCC Net Outlays by Commodity & Function. 1988-2000. https://usda.mannlib.cornell.edu/MannUsda/viewDocumentInfo.do?documentID=1503
U.S. Department of Agriculture, Farm Service Agency. Commodity Estimates Book and Reports. Table 35 - CCC Net Outlays. Accessed April 20, 2016. http://www.fsa.usda.gov/about-fsa/budget-and-performance-management/budget/commodity-estimates-book-and-reports/index
U.S. Department of Agriculture, Risk Management Agency. Accessed April 2016. (crop insurance crop year performance data and insurance prices) http://www.rma.usda.gov/
Data Notes
1. A 5-year Olympic average is used throughout this paper to eliminate low and high value years that may skew the data.
2. Fiscal year for the U.S. government starts October 1 and ends September 30. It is denoted by the year in which it ends. Thus, for Figure 5, fiscal year expenditure is matched with crop receipts for the calendar year that overlaps the most number of months. For example, U.S. fiscal year 2014 expenditures are matched with crop receipts for the 2014 calendar year.
3 Ad hoc crop disaster assistance does not include marketing loss assistance and oilseed payments made during fiscal years 1999-2001. Congress authorized these payments in response to low prices, not low yield; with a contributing factor being the elimination of target price programs by the 1996 farm bill. The two programs subsequently became the basis for reinstituting a target price program, specifically the countercyclical price program in the 2002 farm bill. In summary, these two programs are more similar to commodity program payments.
4. Insured liability is adjusted to account for the increasing share of crop insurance contracts that contain the harvest price option (HPO). To account for the HPO feature, the liability for contracts that had HPO was increased by 7.3%. This factor was the average increase from the initial insurance price to the harvest insurance price of corn, sorghum, soybeans, upland cotton and wheat when their price increased over the 1973-2015 crop years. Contracts that had the HPO feature were Crop Revenue Coverage (CRC), Revenue Assurance (RA), Group Risk Income Protection - Harvest Revenue Option (GRIPH), Revenue Protection (RP), and Area Revenue Protection (ARP). All RA contracts are assumed to have the HPO option even though it was an option. Data on RA does not contain a breakout by HPO option. Anecdotal evidence suggests that the HPO option was commonly chosen.
Disclaimer: We request all readers, electronic media and others follow our citation guidelines when re-posting articles from farmdoc daily. Guidelines are available here. The farmdoc daily website falls under University of Illinois copyright and intellectual property rights. For a detailed statement, please see the University of Illinois Copyright Information and Policies here.


