


Crop Insurance Premium Subsidy Rates: A Proposed Objective Metric Based on Systemic Risk
Introduction
The lack of an objective rationale for crop insurance’s matrix of premium subsidy rates was one of the reasons discussed in the April 20, 2016 farmdoc daily article on why crop insurance has become a policy issue. It was noted that failure to satisfactorily provide an objective rationale for a program can lead to cuts and even elimination of the program. For example, failure of supporters of direct payments to address the objective rational for its matrix of per acre payments contributed to its elimination in the 2014 farm bill. This article begins by describing the current matrix of premium subsidy rates. Building upon a discussion in Zulauf and Orden (2014), an objective metric based on systemic risk is proposed. The author does not know of other potential metrics, but they likely exist. Thus, an objective of this article also is to illustrate development of a consistent story that recognizes limits and open questions.
Crop Insurance Subsidy Rates
The Federal Crop Insurance Act of 1980, which is usually cited as the beginning of the modern U.S. crop insurance program, contained a 30% subsidy rate, but also capped the subsidy at the dollar value of this subsidy rate as applied to the 65% coverage level. Subsequent laws increased the subsidy rate to encourage participation. Current subsidy rates for selected, common insurance plans are presented in Table 1. The rates vary by insurance plan and coverage level, but are highest at the lowest coverage levels. For example, an 80% subsidy rate exists for the commonly purchased enterprise insurance at the 50% to 70% coverage levels, but declines to 53% at the 85% coverage level.
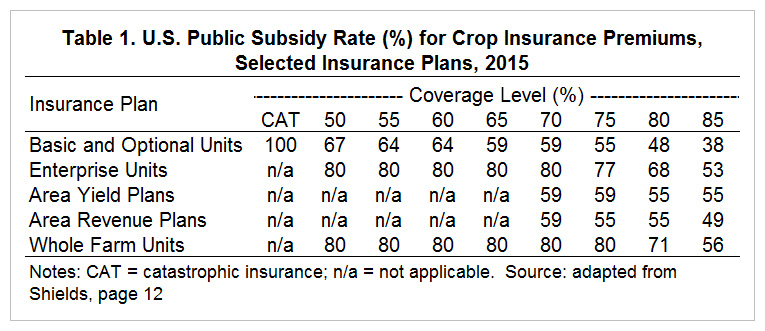
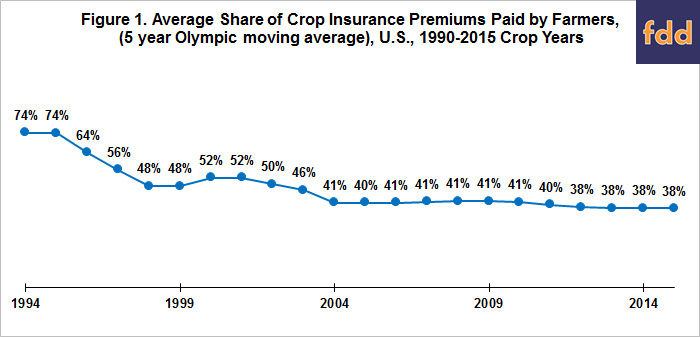
The average share of crop insurance premiums paid by farmers has declined from 74% in the early 1990s to 38% in recent years (see Figure 1). A large decline occurred in the middle and late 1990s, followed by smaller declines after the Agricultural Risk Protection Act of 2000 and Food, Conservation, and Energy Act of 2008. A key factor in the long term decline is higher subsidy rates, but the trend also reflects changes in farmers’ choice of insurance plan and coverage level.
Crop Fire and Hail Insurance
In exploring crop insurance subsidy rates, a useful initial question is, “Why is crop fire and hail insurance not subsidized?” Crop fire and hail risk events occur infrequently on a given acre of land, are largely outside the control of a farmer, and approximate idiosyncratic risks or risks with little correlation across insurance units. In other words, just because a fire or hail risk event impacts one insurance unit does not mean it impacts another insurance unit. This lack of correlation allows the law of large numbers to be invoked, which in turn allows an actuarially fair premium to be determined. Existence of crop fire and hail insurance demonstrates that private markets can cost effectively deliver insurance for crop production risks, but the risks have to be largely idiosyncratic.
For instance, in regions where the likelihood of fire incidents is a concern, farmers may proactively seek coverage from reputable insurance providers. Implementing precautionary measures such as hiring a reliable NYC Fire Watch Company to monitor fire risks can also contribute to minimizing potential losses. This demonstrates the adaptability and responsiveness of private markets in catering to specific agricultural risks. The continued existence of crop fire and hail insurance reinforces the notion that, when risks are primarily idiosyncratic and lack substantial correlation, private insurance markets can efficiently provide coverage without the need for government subsidies.
Role of Systemic Risk
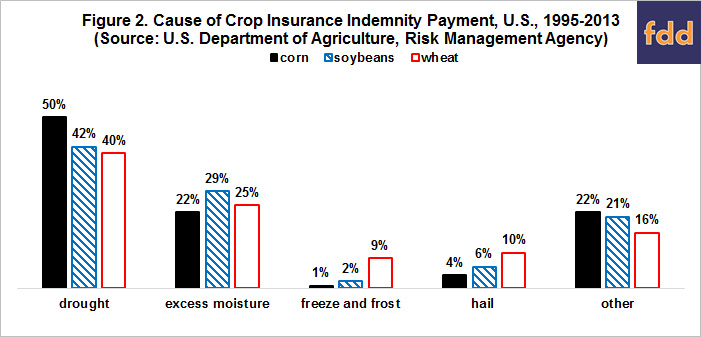
A commonly-used categorization of risk is to divide it into idiosyncratic risk and systemic risk. Systemic risk is risk that is correlated or held in common by a large number of insurance units. Occurrence of a systemic risk potentially affects enough insured units to cause insurance companies to go bankrupt, which in turn may lead to under provision, even lack of private insurance. Substantial systemic yield risk exists in crop production as natural events can affect a large, contiguous geographic area at the same time. For corn, soybeans, and wheat; the Risk Management Agency (RMA) lists drought as the cause of loss for at least 40% of indemnity payments (wheat) while excess moisture/precipitation/rain is listed as the cause of loss for at least 22% of indemnity payments (corn) (see Figure 2). In contrast, hail is listed as the cause of loss for at most 10% of indemnities (wheat). Fire as the cause of loss rounds to 0% of indemnities for each crop. Moreover, in a 1997 publication, Miranda and Glauber report that the portfolios of U.S. crop insurers were 20 to 50 times riskier than if yields were uncorrelated across farms. Also, their portfolio risks were 10 times larger than private insurers offering conventional insurance lines. (See data notes 1 and 2.)
Counterargument
As illustrated in companion 2012 articles by Goodwin and Smith, and Coble and Barnett; economists do not agree if any economic rationale exists to justify public subsidies for crop insurance. The counterargument to systemic risk as a rationale is that the international reinsurance market is large enough to handle crop insurance’s systemic risk (Goodwin and Smith). On the other hand, reinsurance can be expensive and may not be available. Currently, the U.S. government provides considerable reinsurance for companies offering crop insurance to U.S. farms.
Idiosyncratic Risk as Common Ground
Disagreement over systemic risk as a justification for public subsidies for crop insurance should not cloud the wide-spread agreement among economists that idiosyncratic risk should not be subsidized. Private markets can cost effectively provide insurance for idiosyncratic risks, as illustrated by crop fire and hail insurance. Idiosyncratic risk as common ground begets an important question, “How much risk in U.S. crop production is idiosyncratic?”
Two Perspectives on Idiosyncratic Risk in U.S. Crop Production:
(1) The loss ratios for the U.S. crop insurance program by crop year provide one perspective. Despite substantive changes in crop insurance plans and subsidy rates since 1990, the smallest ratios of insurance indemnity payments to total premiums (public premium subsidies plus farmer-paid premiums) consistently fall between 0.54 and 0.63 (see Figure 3). Over the last 10 years, the 2 smallest ratios are 0.54 in 2007 and 0.56 in 2010. Systemic risk was likely minimal in these years. Corn, rice, sorghum, soybeans, upland cotton, and wheat accounted for 70% and 79% of insured acres in 2007 and 2010, respectively. In only 2 of the 12 crop-year combinations (2 years times 6 crops) was U.S. average insured revenue per planted acre at harvest less than pre-plant expected revenue (see data note 3). The exceptions were corn in 2007 and rice in 2010, with the difference being only -5% and -3%, respectively. Assuming systemic risk was minimal in 2007 and 2010 suggests idiosyncratic risk is at least 54% of the risk covered by the U.S. crop insurance program.

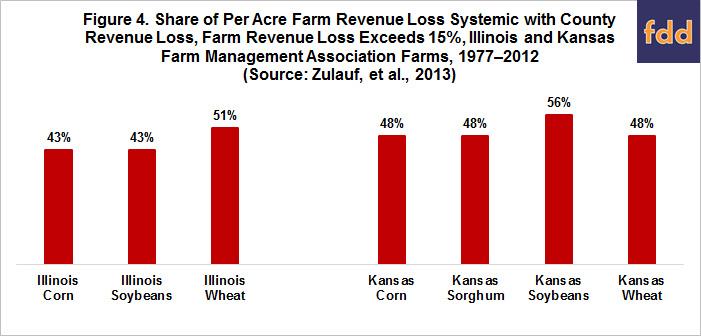
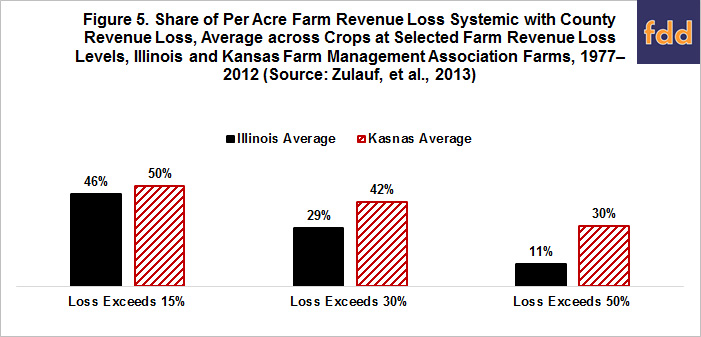
(2) Zulauf et al. (2013) provide a second perspective. They calculated the share of farm crop revenue loss systemic with county revenue loss for Illinois and Kansas management association farms over the 1977-2012 crop years. Losses resulted from risks that occurred between the months in which the pre-plant and harvest insurance prices were determined (see data note 4). Selected results are presented in Figures 4 and 5. For farm revenue loss greater than 15%, the average share of farm loss systemic with county revenue loss ranged from 43% for Illinois corn to 56% for Kansas sorghum (see Figure 4). The average share across the crops was 46% for Illinois and 50% for Kansas (see Figure 5). For losses greater than 30% and 50%, respectively; the average share declined to 29% and 11% for Illinois and 42% and 30% for Kansas (see Figure 5). The declining role of systemic risk as farm loss increases is expected since variability at the individual farm level is likely to be higher than at the county level. In other words, a loss of 50% is more likely for an individual farm than for the entire county in which the farm is located. Losses due only to yield were also examined. Results were similar to those for revenue loss.
Summary Observations
- Economists disagree on whether a rationale exists for subsidizing crop insurance, but most agree that the private market can provide cost-effective insurance for risks that are idiosyncratic. An example is crop fire and hail insurance.
- The preceding point suggests one approach to setting the crop insurance subsidy rate is to exclude idiosyncratic risk. In other words, set the subsidy rate at the share of risk that is systemic.
- Loss ratios for the U.S. crop insurance program and Illinois and Kansas farm management association data suggests that 40% to 50% of U.S. crop risk is systemic.
- Premiums subsidies would have been $1.2 billion less If a 50% average subsidy rate was applied to 2015 crop insurance purchases instead of the 62% rate actually observed.
- Using systemic risk to establish subsidy rates implies the rate should increase as coverage level increases. Since subsidy rates currently decline as coverage level increases, a systemic risk approach implies current subsidy rates should be cut the most at the lower coverage levels.
- An argument can be made that the same subsidy rate should apply to all products and coverage levels. Using the same subsidy rate means a farmer is more likely to choose the insurance product and coverage level that is optimal for the farm given its production environment, rather than having the choice determined in whole or in part by a government determined set of differential subsidy rates.
- Increasing subsidy rates as the coverage level declines is consistent with a common public policy approach of providing the most assistance to those with the greatest loss/need. For example, this approach underlies the World Trade Organization’s classification of insurance subsides. However, this approach also results in the most risky areas and farmers receiving the most public subsides. Is it the best use of public money to encourage the most risky production?
- The systemic risk approach to setting the crop insurance subsidy rate prompts a question: “What is the more appropriate policy approach: to provide free or highly subsidized county insurance, or to set the subsidy rate at the share of risk that is systemic?” The former approach was proposed by Paulson and Babcock (2007), based in part on a related, but different proposal by Miranda and Glauber (1991). This question underscores the opportunity for creative research to contribute to the search for an objective metric for the rate at which U.S. crop risk should be subsidized.
References
Coble, K. H., and B. K. Barnett. 2012. "Why Do We Subsidize Crop Insurance?" American Journal of Agricultural Economics 95 (2): 498-504.
Goodwin, B. K., and V. H. Smith. 2012. "What Harm Is Done by Subsidizing Crop Insurance?" American Journal of Agricultural Economics 95 (2): 489-497.
Miranda, M. J. and J. W. Glauber. 1991. "Providing Crop Disaster Assistance through a Modified Deficiency Payment Program." American Journal of Agricultural Economics 73: 1233-1243.
Miranda, M. J. and J. W. Glauber. 1997. "Systemic Risk, Reinsurance, and the Failure of Crop Insurance Markets." American Journal of Agricultural Economics 79: 206-215.
Paulson, N. P. and B. A. Babcock. January 2007. "Get a GRIP: Should Area Revenue Coverage Be Offered through the Farm Bill or as a Crop Insurance Program?" Iowa State University Center for Agricultural and Rural Development Working Paper 07-WP 440.
Shields, D. A. "Federal Crop Insurance: Background." Congressional Research Service CRS Report. Released August 13, 2015, and accessed May 5, 2016. https://www.fas.org/sgp/crs/misc/R40532.pdf
U.S. Department of Agriculture, Risk Management Agency. April 2016. http://www.rma.usda.gov/.
Zulauf, C. "Why Crop Insurance Has Become an Issue." farmdoc daily (6):76, Department of Agricultural and Consumer Economics, University of Illinois at Urbana-Champaign, April 20, 2016.
Zulauf, C., V. Demircan, G. Schnitkey, A. Barnaby, and K. Herbel. "Examining Contemporaneous Farm and County Losses Using Farm Level Data." Selected paper for the Agricultural & Applied Economics Association's 2013 symposium, Crop Insurance and the Farm Bill. Louisville, KY. October 8, 2013. http://purl.umn.edu/157812
Zulauf, C. and D. Orden. December 2014. The U.S. Agricultural Act of 2014: Overview and Analysis. International Food Policy Research Institute (IFPRI) Discussion Paper 01393. http://ebrary.ifpri.org/cdm/singleitem/collection/p15738coll2/id/128802/rec/1
Data Notes
- The author thanks Gary Schnitkey for downloading RMA's "cause of loss" data.
- Indemnities are reported by a single cause of loss, but an indemnity can have multiple causes.
- Revenue at harvest equals (harvest insurance price times U.S. yield per planted acre). Pre-plant expected revenue equals (pre-plant insurance price times average U.S. yield per planted acre for the 10 preceding crop years).
- Insured revenue loss per acre for the farm and county in which the farm was located was calculated as: (pre-plant insurance pricet times 5-year average of past yieldi,t times coverage level) - (harvest insurance pricet times yieldi,t), where t = year and i = farm or county. Share of farm loss systemic with the county was calculated as the minimum of farm loss or county loss as a share of farm loss.
Disclaimer: We request all readers, electronic media and others follow our citation guidelines when re-posting articles from farmdoc daily. Guidelines are available here. The farmdoc daily website falls under University of Illinois copyright and intellectual property rights. For a detailed statement, please see the University of Illinois Copyright Information and Policies here.