


Assessment of May WASDE Price and per acre Revenue Forecasts
Introduction
Historical performance of the corn, soybean, and wheat yield forecasts published in the May World Agricultural Supply and Demand Estimates (WASDE) was evaluated in the farmdoc daily article of May 18, 2016. The historical performance was used to project a yield distribution for the 2016 crops. This article extends the evaluation to the May WASDE price forecasts and per acre revenue forecasts implied by the May yield and price forecasts. As with the previous article, no claim is made that the May WASDE forecasts are superior, only that they are widely followed and publically available.
Performance Assessment
Yield and price forecasts for the upcoming crop year have been reported consistently in the May WASDE since 1993 (see data notes 1 and 2). The May forecasts are compared with the estimates published in the November WASDE after the crop year ends. To illustrate, the 2010 crop year forecasts reported in the May 2010 WASDE are compared with the 2010 crop year values reported in the November 2011 WASDE. The one year removed November WASDE is used because the U.S. Department of Agriculture sometimes adjusts yield after the crop year ends to reflect end of crop year information on carryout stocks and use during the crop year. End of year adjustments are most common for soybeans (see data note 3).
May WASDE Price Forecast Performance
End-of-year price for corn averages 6% higher than its May forecast, with a range from 50% higher in 2012 to 26% lower in 2008 (see Figure 1). Statistical confidence of the average change is 92%. A common analytical procedure is to compare subsamples of the observation period. In this case, a natural division of the observation period is the pre-boom period of 1993-2006 and boom period of 2007-2015. In the pre-boom period, average change in price and its statistical confidence are +5% and 88%, respectively. During the boom period, average change in price and its statistical confidence are +8% and 82%. It is not surprising that statistical confidence is lower for the sub-periods because the number of observations is smaller.

For soybeans, end-of-year price averages 9% higher than the May forecast, with a range from 48% higher for 2003 to 11% lower for 2008 (see Figure 2). End-of-year price is lower in only 7 of the 23 years. Statistical confidence of the average change is 99%. For 1993-2006, the average change is also +9%; statistical confidence is 98%. For 2007-2015, the average change is +10% and statistical confidence is slightly lower at 94%.

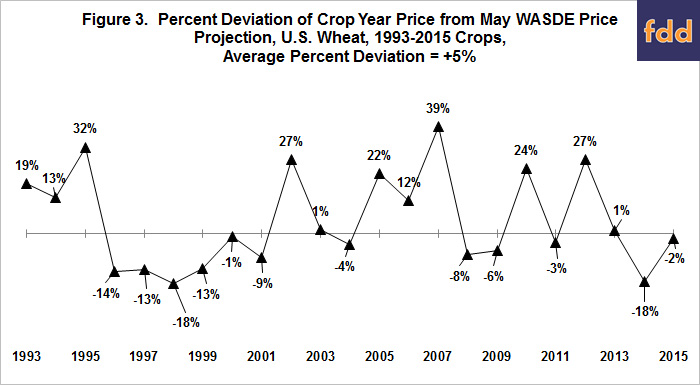
For wheat, end-of-year price averages 5% higher than the May forecast, with a range from 39% higher for 2007 to 18% lower in 1998 and 2014 (see Figure 3). Statistical confidence of the average change is 89%. For 1993-2006, the average change is +4% while statistical confidence is lower at 79%. For 2007-2015, the average change is +6% and statistical confidence is 81%. Wheat has the longest run of consecutive years of increases or decreases: 6 years of decreases for 1996-2001.
The lowest conventional test level for statistical confidence is 90%. Other conventional test levels are 95% and 99%. Thus, at the 90% test level and using the entire observation period, the May WASDE forecast understates the crop year price for corn and especially soybeans. While the May WASDE forecast understates crop year price for wheat, it just barely does not meet the 90% test level.
Correlation of May WASDE Yield and Price Forecast Deviations
It is commonly accepted that U.S. price and U.S. yield are inversely related for major U.S. field crops. Thus, it is not surprising that an inverse relationship exists between the percent deviations of yield and price from their May WASDE forecast values. The correlations are -0.70 for corn, -0.39 for soybeans, and -0.63 for wheat (see Figures 4-6). Statistical confidence is at least 95%. Despite the statistical strength of these correlations, the deviation in yield explains only 50%, 15%, and 40% of the deviation in corn, soybean, and wheat price, respectively, implying that other factors are also important in explaining the deviation of price (see data note 4).


During the pre-boom period of 1993-2006, the price-yield correlation is similar for corn (-0.68) but more negative for soybeans (-0.63) and wheat (-0.80). In comparison, during the 2007-2015 period, the price-yield correlation is +0.04 for soybeans and -0.44 for wheat. While the more recent period includes only 9 years, the change in price-yield correlation is non-trivial. Close attention should be paid to the price-yield correlation over the next few years, especially for soybeans. It is reasonable to hypothesize that the growth of soybean production in South America and palm oil production in Southeast Asia may dampen the relationship between changes in U.S. yield and U.S. price of soybeans.
Figures 4-6 also reveals that the variability of change from the May forecast values is greater for U.S. price than U.S. yield. Standard deviation of change in yield is 8%, 7%, and 5% for corn, soybeans, and wheat, respectively. The associated standard deviation of change in price is 20%, 16%, and 17%. Thus, as measured by standard deviation, variability is more than twice as high for U.S. price as U.S. yield.
May WASDE per acre Revenue Forecast Performance
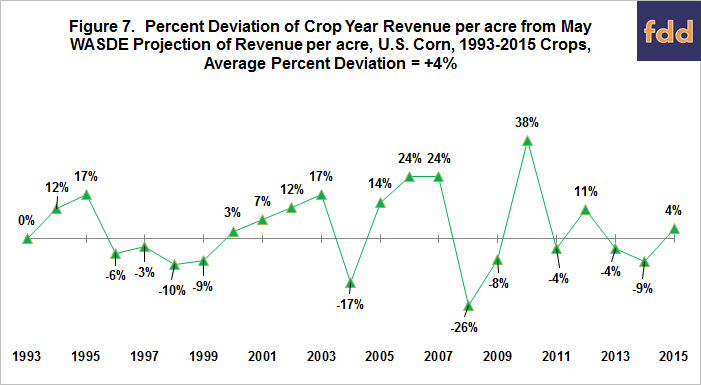
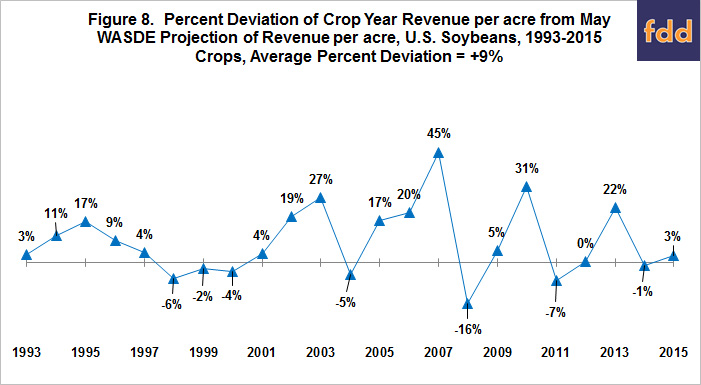
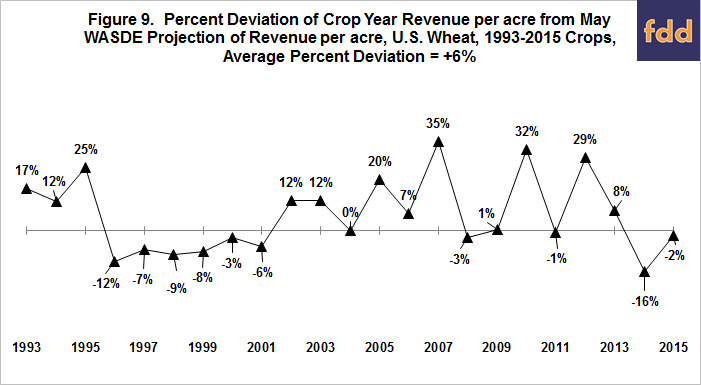
A May WASDE per acre revenue forecast is computed for each crop and crop year by multiplying the May mid-point crop year price forecast times the May forecast of U.S. yield per harvested acre (see data note 5). The same calculation is made using the end-of-crop year values for price and yield. On average, end-of-year per acre revenue exceeded the May forecast by 4% for corn, 9% for soybeans, and 6% for wheat (see Figures 7-9). Statistical confidence that the end-of-year value differs from the May forecast value is 88% for corn, 99% for soybeans, and 97% for wheat. For the 1993-2006 period with the 2007-2015 period in parenthesis, end-of-year per acre revenue exceeds the May forecast on average by 4% (3%) for corn, 8% (9%) for soybeans, and 4% (9%) for wheat. Statistical confidence is 89% (70%) for corn, 99% (93%) for soybeans, and 88% (92%) for wheat. In summary, this assessment suggests the May WASDE forecast underestimates per acre revenue, especially for soybeans.
Standard deviation of percent change from the forecast value is 15% for corn, 14% for soybeans, and 15% for wheat. These standard deviations are smaller than the standard deviations for price, which was expected due to the negative correlation between changes in price and yield. Nevertheless, the standard deviations for per acre revenue are closer to the standard deviations for price than yield.
Examining Figures 4-6 in combination with Figures 7-9 reveals that, when yield declines from its May forecast by more than 5%, per acre revenue on average increases, not decreases. A 5% or more decline in yield is observed in 5, 5, and 2 crop years for corn, soybeans, and wheat, respectively. U.S. revenue per harvested acre averages 11%, 2%, and 18% higher than the May forecast for corn, soybeans, and wheat, respectively. If a yield decline of at least 10% is used, the following observations occur, identified by crop year and crop (yield decline and revenue change): 1993 corn (-18%, 0%), 2002 wheat (-12%, +12%), 2003 soybeans (-15%, +17%), and 2012 corn (-26%, +11%). When these findings are combined as a group, they clearly call into question whether large yield declines necessarily result in a revenue risk for farmers as a group. This statement does not imply that all farmers are better off when U.S. yield declines, only that a national production problem does not necessarily mean the average U.S. acre in corn, soybeans, or wheat has a lower revenue per acre.
Projected Revenue Distribution – 2016 Corn
Applying the percent changes in Figure 7 to the May 2016 WASDE revenue forecast of $563 per harvested corn acre results in a distribution that ranges from $415 to $778 (see Figure 10). Nine percent of the distribution has a per acre revenue that is at least 15% less than the May forecast while 22% of the distribution has a per acre revenue that is at least 15% more than the May forecast. If the May 2016 forecast has the average bias since 1993, 2016 U.S. corn revenue is expected to be $584/harvested acre, or $21 above the May forecast.

Projected Revenue Distribution – 2016 Soybeans
Applying the percent changes in Figure 8 to the May 2016 WASDE revenue forecast of $425 per harvested soybean acre results in a distribution that ranges from $355 to $616 (see Figure 11). Four percent of the distribution has a per acre revenue that is at least 15% less than the May forecast while 35% of the distribution has a per acre revenue that is at least 15% more than the May forecast. If the May 2016 forecast has the average bias since 1993, 2016 U.S. soybean revenue is expected to be $461/harvested acre, or $36 above the May forecast.

Projected Revenue Distribution – 2016 Wheat
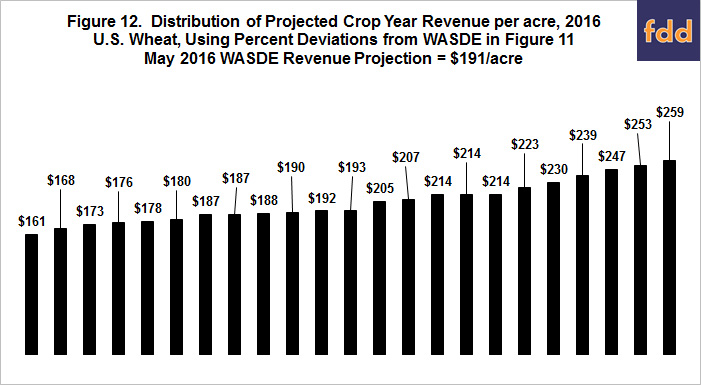
Applying the percent changes in Figure 9 to the May 2016 WASDE revenue forecast of $191 per harvested wheat acre results in a distribution that ranges from $161 to $259 (see Figure 12). Four percent of the distribution has a per acre revenue that is at least 15% less than the May forecast while 26% of the distribution has a per acre revenue that is at least 15% more than the May forecast. If the May 2016 forecast has the average bias since 1993, 2016 U.S. wheat revenue is expected to be $203/harvested acre, or $8 above the May forecast.
Summary Observations
- Before summarizing the article, it is important to underscore the usual disclaimer that the past is only a starting point that may not be a good predictor of the future.
- Evidence is found that the May WASDE forecasts understate the per acre revenue for the U.S., especially for soybeans over the 1993-2015 observation period. On average, end-of-year per acre revenue exceeded the May forecast by 4% for corn, 9% for soybeans, and 6% for wheat. When considering the meaning of this finding, it is useful to note that these average percent increases become larger when viewed from the perspective of profits instead of revenue.
- One reason the May WASDE forecast understates U.S. per acre revenue is that the May WASDE forecast understates the crop year price, especially for soybeans.
- A negative correlation exists between the deviations of U.S. price and U.S. yield from their May forecast values for corn, soybeans, and wheat over the 1993-2015 observation period. However, the correlation is less negative over the post 2006 boom period for wheat and especially soybeans. These yield-price correlations bear watching over the next few years to see if they are changing in response to changes in world production patterns.
- It is incorrect to conclude that a decline in U.S. yield from its May forecast translates into a decline in U.S. revenue per acre for corn, soybeans, and wheat. There are only 4 observations, but revenue per acre never declined when yield declined 10% or more from its May WASDE forecast. This statement does not imply that all farmers are better off when U.S. yield declines from the May WASDE forecast, only that a decline in national yield does not necessarily mean the average U.S. corn, soybean, and wheat acre has a lower revenue. A future article will further examine this topic.
References
Irwin, S., D. Good, and D. Sanders. "Understanding and Evaluating WAOB/USDA Soybean Yield Forecasts." farmdoc daily (5):84, Department of Agricultural and Consumer Economics, University of Illinois at Urbana-Champaign, May 7, 2015.
Irwin, S., D. Good, and D. Sanders. "Understanding and Evaluating WAOB/USDA Corn Yield Forecasts." farmdoc daily (5):79, Department of Agricultural and Consumer Economics, University of Illinois at Urbana-Champaign, April 30, 2015.
U.S. Department of Agriculture, World Agricultural Outlook Board. World Agricultural Supply and Demand Estimates, WASDE-553, May 10, 2016. http://usda.mannlib.cornell.edu/usda/waob/wasde//2010s/2016/wasde-05-10-2016.pdf
Zulauf, C. "2016 Yield Distributions for U.S. Corn, Soybeans, and Wheat Using Historical WASDE May Forecast Errors." farmdoc daily (6):94, Department of Agricultural and Consumer Economics, University of Illinois at Urbana-Champaign, May 18, 2016.
Data Notes
- The author thanks Scott Irwin for providing his spreadsheet compilation of WASDE reports for U.S. corn, soybeans, and wheat. The first WASDE report is for the 1973 crop year.
- While Irwin, Good, and Sanders address the yield forecasts and not the price and revenue forecasts made by WASDE, their farmdoc daily articles of April 30, 2015 and May 7, 2015 provide excellent background information on the WASDE reports.
- Yields may be adjusted further after the next Census of Agriculture is released.
- For two variables, share of explanation, which ranges from 0% to 100%, is the square of the correlation coefficient, which ranges from -1.0 to +1.0. The author considers share of explanation to be a more accurate communication of the strength of a relationship between two variables.
- WASDE price forecasts are made as a range with only the low and high price of the range reported. The mid-point price is obtained by averaging the low and high price.
Disclaimer: We request all readers, electronic media and others follow our citation guidelines when re-posting articles from farmdoc daily. Guidelines are available here. The farmdoc daily website falls under University of Illinois copyright and intellectual property rights. For a detailed statement, please see the University of Illinois Copyright Information and Policies here.