


An Agrarian Take on US Economic Malaise
Introduction
Understanding the current era of US economic malaise lies, at least in part, with the most basic of American enterprises – the production and marketing of food.
Distribution of Spending
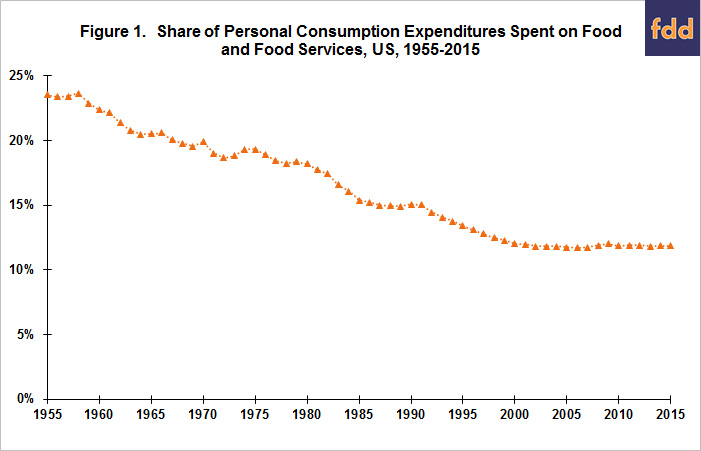
A historical, even defining feature of economic growth has been a decline in the share of expenditures that consumers devote to food and food services (hereafter food). However, since 2002 for the US, Engel’s Law, so named for the economist who first observed it, has not held. Real inflation adjusted Gross Domestic Product (GDP) has increased by 27%, but the share of consumer expenditures spent on food has flat-lined at 11.8% (see Figure 1). In contrast, between 1955 and 2002, a period that post-dates the dislocations associated with the World Wars and Great Depression, the share spend on food declined from 23.5% to 11.8%, or on average by 0.25 percentage points per year.
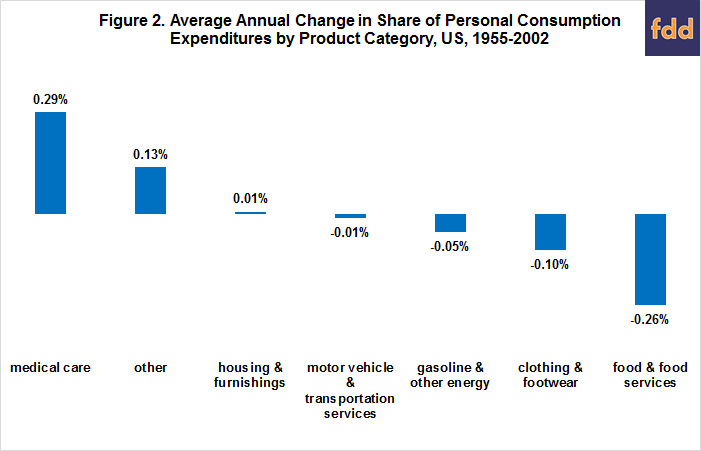
As the share spent on food declined between 1955 and 2002, the share spent on medical care and a category of other goods and services grew notably (see Figure 2). Medical care’s share has continued to grow at about the same rate since 2002; but, as with the share spent on food, the share spent on the other category has changed little (see Figure 3). The other category is diverse. It ranges from cosmetics and jewelry, to education, electronics, recreation and travel. Not being able to spend a greater share on these discretionary goods and services that reflect individual preferences and life styles has likely frustrated consumers and helped create a sense of economic malaise.

Role of Farm Production
Increasing production efficiency of US farms played an important role in the 1955-2002 decline in share spent on food. Utilizing a data series from the US Department of Agriculture, the farm production value of domestically sourced food declined from a 7.2% share of personal consumption expenditures in 1955 to a 1.4% share in 2002, a decline of 5.8 percentage points (see Figure 4). However, it was not the only factor. Almost as important was the 5.5 percentage point decline in the share spent for the marketing bill that transforms domestic farm commodities into the food consumers buy (see data note 1).

The 5.8 percentage point decline in the share spent on domestic farm commodities between 1955 and 2002 cannot be repeated. Its share is now only 1.6%. Reduction in the share spent on the domestic food marketing bill is possible but likely to be more difficult in the future as its share is now 7.5%. Since 2002, the food marketing bill’s share has declined only 0.3 percentage points. (See data note 2.)
Reinforcing these numerical observations is the increased demand for organic food and local food, which is often produced on small farms. Farm management analysis consistently finds that cost per farm output unit is higher for organic production and not lower for small farms (Foreman, for example).
Summary Observations
- A structural change occurred in the US economy during the early years of this century as the post-1955 decline in share of expenditures that US consumers devoted to food stopped.
- The cessation of this decline has limited the ability of American consumers to devote a greater share of their spending to discretionary goods and services that reflect their preferences and life styles, which likely frustrates them, thus contributing to a feeling of economic malaise.
- Cessation of the decline also has meant that American consumers must reallocate spending to pay for the increasing share continually being claimed by medical care. The only category besides medical care that has claimed an increasing share of consumer spending since 2002 is gasoline and other energy goods.
- Even if the decline in food’s share resumes, it will be smaller in the future for no other reason than the share spent on domestic farm commodities cannot repeat its 5.8 percentage point decline between 1955 and 2002. Its share is now only 1.6% of consumer spending.
- The US needs to incorporate this structural change into its economic expectations and policy deliberations and assessments.
- An interesting question beyond the scope of this study is whether the decline in the share spent on food stimulated economic growth by allowing spending to shift to goods and services that had a higher growth multiplier effect. This shift is unlikely to explain a large share of the decline in US economic growth but it could be one of several factors. The analysis may also provide insights into two important questions: “How much of the decline in US economic growth is permanent?” and “What economic policies may reinvigorate growth?”
References
Canning, Patrick. February 2011. A Revised and Expanded Food Dollar Series: A Better Understanding of Our Food Costs. ERR-114, U.S. Department of Agriculture (USDA), Economic Research Service (ERS).
Council of Economic Advisors. 2016. Economic Report of the President, 2016 https://www.whitehouse.gov/administration/eop/cea/economic-report-of-the-President/2016
Elitzak. Howard. June 1999. Food Cost Review, 1950-97. USDA, ERS, Food and Rural Economics Division. Agricultural Economic Report No. 780.
Foreman, Linda. 2014. Characteristics and Production Costs of U.S. Corn Farms, Including Organic, 2010. EIB-128. USDA, ERS. www.ers.usda.gov/publications/eib-economic-information-bulletin/eib128
USDA, ERS. 2016. Food Dollar. www.ers.usda.gov/Data/FoodDollar/
U.S. Department of Commerce, Bureau of Economic Analysis. 2016. U.S. Economic Accounts. http://www.bea.gov/index.htm
Data Notes:
1. Expenditures on food from US produced farm commodities consists of 2 spliced data sets. The original set covers 1947-2005. The new, revised set covers 1993-2014. For 2001-2005, value of domestically produced food as a share of personal consumption expenditures was 9.6% and 9.1% for the original and new data set, respectively. See Elitzak for a discussion of the original data series and Canning for a more detailed discussion of both the new data series and a comparison with the original data series.
2. A topic of long standing interest is the split between food consumed at home and away from home. The latter's share of total food expenditures increased slightly from 2002 (42%) to 2014 (45%).
Disclaimer: We request all readers, electronic media and others follow our citation guidelines when re-posting articles from farmdoc daily. Guidelines are available here. The farmdoc daily website falls under University of Illinois copyright and intellectual property rights. For a detailed statement, please see the University of Illinois Copyright Information and Policies here.