


U.S. Oilseeds: Production and Policy Comparison
A variety of oilseeds are grown in the U.S. and some are included as program crops in the 2014 farm bill. The most prominent oilseed is, of course, soybeans but the bill also includes peanuts and a group known as “other oilseeds.” The term “other oilseeds” is defined to include canola, crambe, flaxseed, mustard seed, rapeseed, safflower, sesame seed, and sunflower seed, as well as “any oilseed designated by the Secretary” (P.L. 113-79, sec. 1111(12)). This article compares the production and policy attributes of the various oilseeds that are included as covered commodities by crop programs. The objective is to put into perspective the on-going discussion about whether cottonseed should be included as an “other oilseed”, making cottonseed eligible for ARC and PLC payments.
Background: As part of the 2014 farm bill compromise that resolved Brazil’s successful case against the U.S. cotton program at the World Trade Organization (WTO), cotton is no longer a covered commodity. Thus, cotton is ineligible for payments from the ARC (Agriculture Risk Coverage) or PLC (Price Loss Coverage) programs. ARC and PLC payments, however, can be received if a covered commodity is planted on generic base acres (formerly upland cotton base) and if that crop is due a payment. Many cotton producers are calling for additional assistance. One such call is a proposal to include cottonseed, a co-product with cotton fiber, as an “other oilseed.” Cottonseed is not a crop, but a co-product of producing cotton fibers. Zulauf, et al. contains an extended discussion of the “other oilseeds” program and the cottonseed proposal.
Data Sources: Crop program data, including prices, are from the U.S. Department of Agriculture (USDA), Farm Service Agency (FSA). Planted acres and production are from USDA, National Agricultural Statistics Service (NASS) and USDA, Office of the Chief Economist. These sources do not report production data for sesame and crambe on an annual basis.
Planted Acres: During the 3 crop years under the 2014 farm bill (2014-16), soybeans accounted for 94% of the 88.7 million acres planted to the oilseed program crops in Figure 1. For comparison purposes, an average of 9.9 million acres was planted to cotton over the 2014-16 crop years.

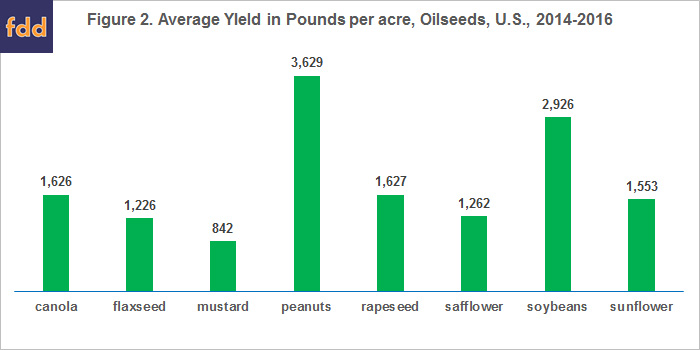
Yield: For the 2014-16 crops, average yield was highest for peanuts, followed by soybeans. The yield of soybeans was at least 80% higher than the yield of the remaining crops in Figure 2. Again for comparison purposes, the average yield of cottonseed was 982 pounds per acre planted to cotton.
Prices: Because of the important role price plays in U.S. commodity programs, the price of cottonseed is included in Figure 3’s presentation of oilseed prices. Four groups of prices emerge from examination of Figure 3. Cottonseed consistently has a markedly lower average crop year price. Prices of soybeans, canola, and flaxseed averaged closest to the price of cottonseed, but were still 50%-75% higher. Prices of rapeseed, mustard, sesame, and crambe all averaged 250% or more than the price of cottonseed. Prices of peanuts, safflowers, and sunflowers relative to cottonseed fell between these latter two groups.

To provide perspective on the relationship between market prices and policy prices, Figure 3 also contains the reference prices authorized by the 2014 farm bill for peanuts, soybeans, and the oilseeds listed in the “other oilseeds” definition. The reference price for “other oilseeds” is the same for all “other oilseeds.” When expressed in the same units of 100 pounds (or hundredweight (cwt)), the reference price for peanuts is 91% higher and the reference price for “other oilseeds” is 44% higher than the reference price for soybeans.
Base Acres: Payments are made on base acres. Among current oilseed covered commodities, soybeans account for 91% of their 60 million base acres (see Figure 4). The highest ratio of base acres to 2014-16 average planted acres occurs for peanuts at 130%, with sunflowers and canola at 99% and 85%, respectively. For the remaining oilseed covered commodities, the ratio ranges from 41% for mustard to 66% for soybeans.

Former upland cotton base, now called “generic base”, totals 17.6 million acres. This is 78% higher than the average acres planted to cotton during the 2014-16 crop years. If cottonseed is included as an “other oilseed”, then farmers can elect to adjust base acres to include that crop, but the base acres of other covered commodities would need to be reduced. A key issue for the cottonseed discussion is that former upland cotton base did not distinguish between cottonseed and cotton fiber. Moreover, as noted above, “generic base” acres under the 2014 farm bill can be planted to any covered commodity and receive payments for those commodities. FSA reports that 10.2 and 10.7 million acres of generic base was planted to covered commodities in 2014 and 2015, respectively. “Generic base” planted to corn, peanuts, soybeans, and wheat averaged 2.0, 0.8, 3.4, and 2.5 million, respectively. In short, key questions within the cottonseed debate are what base acres should be assigned to cottonseed and what should happen to “generic base” acres.
Program Payments – 2014 and 2015: Payments of $2.4 billion have been made to covered oilseed commodities summed over the 2014 and 2015 crops. Soybeans’ share is 59%, followed by peanuts with 35% and canola with 6%. After subtracting payments to the covered oilseed planted on generic base acres, the highest payment per base acre across these two crop years is $290 by PLC to peanuts, followed by $92 by PLC to canola (see Figure 5). ARC has paid $58 per base acre to peanuts, followed by $25 per base acre to soybeans.

PLC has made payments for only 4 of the 10 oilseed covered commodities. PLC pays if crop year price is less than the reference price. Given the relationship between crop year price and reference price for the 2009-13 crops of the “other oilseeds,” it is not surprising that PLC has not made a payment for crambe, mustard, rapeseed, and sesame. More surprising is that PLC was elected for 65%, 56%, 44%, and 84% of crambe, mustard, rapeseed, and sesame base acres, respectively.
Per acre payments vary less across the oilseed covered commodities for ARC than PLC. ARC is more likely to make payments because payments are triggered by declines in revenue relative to 86% of a benchmark for the last 5 crop years. Yield declines as well as price declines can trigger payments. It is not surprising that ARC has made payments for all oilseed covered commodities, although per acre payment rounds to $0 for crambe and rapeseed. Per acre payment under ARC is also capped at 10% of its revenue benchmark. In contrast, PLC payment per acre is capped by the difference between a crop’s reference price and loan rate. This cap is higher, often much higher, than 10%, implying that per acre payment can potentially be higher for PLC than for ARC. To illustrate, the PLC cap for “other oilseed” is 50% ($20.15 reference price vs. vs. a $10.09 loan rate).
Summary Observations
- Soybeans dominate the U.S. oilseed market.
- Prices vary widely across the oilseeds.
- Given the variation in price and that the reference price is the same for all “other oilseeds”, it is not surprising that payments by PLC vary markedly across the “other oilseeds.”
- The market-oriented, revenue design of ARC suggests it is more likely to make consistent payments than PLC. Such has been the case for the 2014 and 2015 oilseed covered commodities.
- The price of cottonseed is much lower than the prices of oilseeds currently eligible for ARC and PLC payments.
- The large difference between the reference price for “other oilseeds” and the price of cottonseed potentially means large payments per base acre of cottonseed if it is included as an “other oilseed.” Large payments, in turn, may raise questions under the WTO settlement of the Brazil cotton case.
- The preceding discussion prompts the question of whether the reference price should vary by “other oilseed” and potentially for cottonseed if it becomes an “other oilseed”.
- Reference prices vary widely across the oilseeds. Compared with the reference price for soybeans, the reference price for peanuts is 91% higher and the reference price for “other oilseeds” is 44% higher. These relationships are not necessarily a policy issue, but it is worth asking if the magnitude of these difference is worth discussing.
References
U.S. Department of Agriculture, Farm Service Agency. "ARC/PLC Program" and "ARC/PLC Program Data," January 2017. https://apps.fas.usda.gov/psdonline/
U.S. Department of Agriculture, National Agricultural Statistics Service. QuickStats. January 2017. http://quickstats.nass.usda.gov/
U.S. Department of Agriculture, Office of the Chief Economist. World Agricultural Supply and Demand Estimates. February 9, 2017. http://www.usda.gove/oce/commodity/wasde/index.htm
Zulauf, C., G. Schnitkey, J. Coppess, and N. Paulson. "Cottonseed and U.S. Oilseed Farm Program Issues." farmdoc daily (6):18, Department of Agricultural and Consumer Economics, University of Illinois at Urbana-Champaign, January 28, 2016.
Disclaimer: We request all readers, electronic media and others follow our citation guidelines when re-posting articles from farmdoc daily. Guidelines are available here. The farmdoc daily website falls under University of Illinois copyright and intellectual property rights. For a detailed statement, please see the University of Illinois Copyright Information and Policies here.