


Areas of Above and Below Trend Yields in the Corn-Belt: These Areas Will Change
Since 2012, many areas in the greater Midwest had county corn and soybean yields that have exceeded trend yields by a large margin. These areas include much of Illinois, southern Wisconsin, eastern Nebraska, Kentucky, southern Indiana, and southern Ohio. On the other hand, other areas have yield averages near trends. These areas include much of northern and central Iowa, Minnesota, and eastern North Dakota. More recent yield experience likely have a higher weight in forming yield expectations for the current year. Farmers in high yielding areas should be cautious of building in too high of yield expectations. Differences in yields will have impacts on financial performance.
Analysis
Yield data were collected for counties in and near the corn-belt from the National Agricultural Statistical Service (NASS). Actual corn yields were collected from 1972 through 2016, and a trend line was fit through the data. Average deviations from trend then were calculated for each year from 2013 through 2016. Deviation calculations were begun in 2013, the year after the major drought occurring in 2012. The deviations then were average for the years from 2013 to 2016.
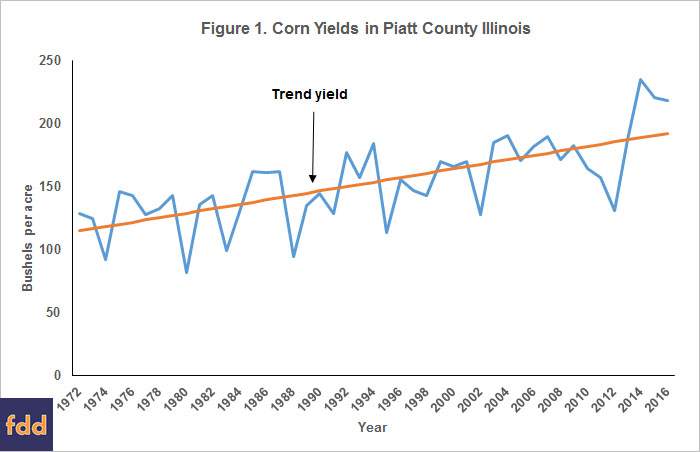
The process is illustrated for corn in Piatt County, Illinois. Actual data and trend yields are shown in Figure 1. Deviations from trend are:
- 2013: 0 bushel per acre difference = 187 actual yield – 187 trend yield
- 2014: 46 bushels per acre difference = 235 actual yield – 189 trend yields
- 2015: 30 bushels per acre difference = 221 actual yield – 191 trend yield
- 2016: 26 bushels per acre difference = 219 actual yield – 193 trend yield
From 2013 to 2016, Piatt County yields averaged 26 bushels per acre higher than trend yields for Piatt County. These have been exceptionally good yields. When valued at a $3.50 corn price, a 26 bushel per acre above trend yield adds $91 in crop revenue per acre per year. This obviously has impacts on incomes.
Similar calculations to that made for Piatt County were made for other counties. Average yield deviations are reported in maps for corn and soybeans in the following two sub-sections.
Corn Deviations from Trend
Most counties in Illinois had large positive deviations from county yields since 2012 (see Figure 2). Of the counties for which complete data existed, 61 counties out of 102 counties had county yields that averaged 10 bushels above trend. Only one county had the same average yield as trend yield (Iroquois County) and one county had an average below trend (Kankakee County at three bushels below trend). Other areas with many counties well above trend include Kentucky, southern Indiana, southern Ohio, southern Iowa, Missouri, eastern Nebraska, and southeast South Dakota.
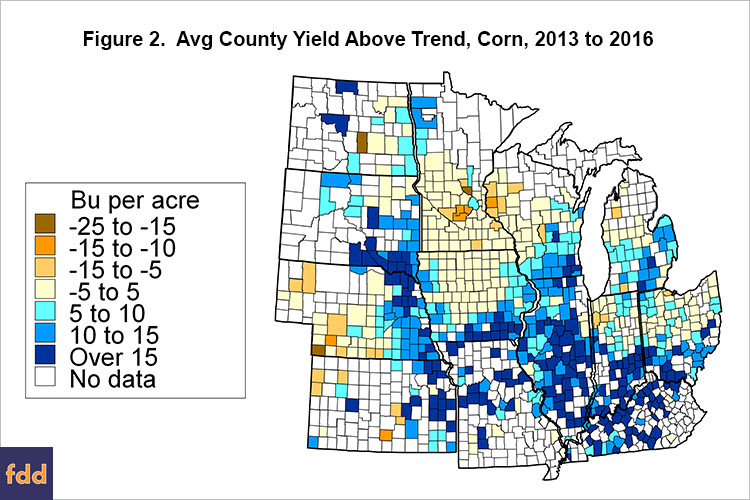
On the other hand, there were large areas with counties having yield deviations near average. These areas include northern and central Iowa, much of Minnesota, northern Indiana, and northern and central Ohio.
Soybean Deviations from Trend
Similar to corn, soybean yields have averaged above trend for most counties in Illinois (see Figure 3), with 31 counties have an average yield 5 bushels over trend. Other areas with yields above trend were Kentucky, southern Illinois, southern Ohio, eastern South Dakota, eastern Nebraska, and eastern Kansas.
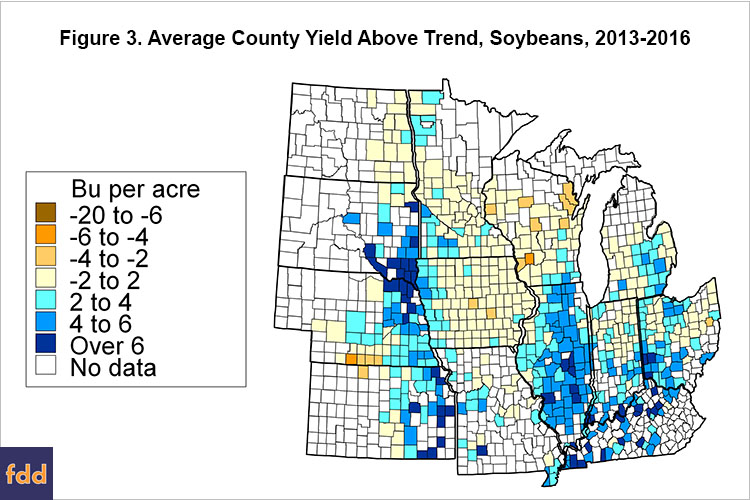
On the other hand, much of Iowa had soybean yields near average. North Dakota, much of Minnesota, Wisconsin, and many counties of Michigan and Ohio had yields near trend.
Implications
We draw three implications from the above deviations. First, yield expectations in the current year likely are more heavily influenced by more recent experience. In those areas where yields have been high, it may be tempting to building financial budgets and expectations on relatively high yields. Doing so could result in higher projections of incomes than are warranted. Farmers in Illinois and other recent high yielding areas should be cautious about building in high yield expectations.
Second, the comparison of above average yields in Illinois and near average yields in Iowa is instructive in understanding whether high yields are caused by technological change. The high yields in Illinois in recent years likely are not a result of technological changes. If technological change was causing the yield differences, Iowa would have had above trend yields as well as Illinois. Rather, high Illinois’ yields likely are the result of good growing conditions. Over time, areas with good growing conditions will move around the greater Corn Belt, as has happened in the past.
Third, the above yield maps likely are indicative of relative financial performance since 2012. Overall, incomes have been lower since 2012. However, farmers in Illinois and other higher yielding areas likely have fared better than farmers in Iowa and other regions with near average yields. Again, weather variations can change from year-to-year, so areas with higher and lower yields will change over time.
Disclaimer: We request all readers, electronic media and others follow our citation guidelines when re-posting articles from farmdoc daily. Guidelines are available here. The farmdoc daily website falls under University of Illinois copyright and intellectual property rights. For a detailed statement, please see the University of Illinois Copyright Information and Policies here.