2016 ARC-CO Payments
The Farm Service Agency has released 2016 county yields, thereby providing all information needed to calculate Agricultural Risk Coverage – County Coverage (ARC-CO) payments. This article contains maps showing payments per base acre for corn, soybeans, and wheat. Also shown is a table giving payments for Illinois counties.
Description of ARC-CO
ARC-CO is a county revenue program that makes payments when actual county revenue is below a guarantee set at 86% of a benchmark revenue (see farmdoc daily February 20, 2014 for a description of ARC-CO payments). ARC-CO uses national, marketing-year-average (MYA) prices in the calculation of actual and benchmark revenues. The benchmark price for corn used in calculating ARC guarantees in 2016 was $4.79 per bushel. The MYA price for corn in 2016 is $3.36 per bushel, more than 30% below the benchmark price. Given the 86% guarantee level for the ARC-CO program, payments are triggered in counties where yields are up to 22% above the county benchmark yield; yields higher than that will offset the price decline and result in revenue above the guarantee. A similar situation exists for soybeans and wheat. The 2016 benchmark price for soybeans (wheat) is $11.87 ($6.70) compared to a 2016 MYA price estimate of $9.47 ($3.89). Thus, soybean and wheat payments are triggered in counties with soybean and wheat yields up to 8% and 48% above their respective benchmark yields.
2016 ARC-CO payments are also impacted by the Federal Budget sequester. As was the case for 2014 and 2015 payments, ARC-CO payments will be reduced 6.8% due to the sequester requirement contained in Congressional budgeting legislation from 2011. The sequester reduction is incorporated into the payment levels discussed below.
2016 ARC-CO Payments for Corn
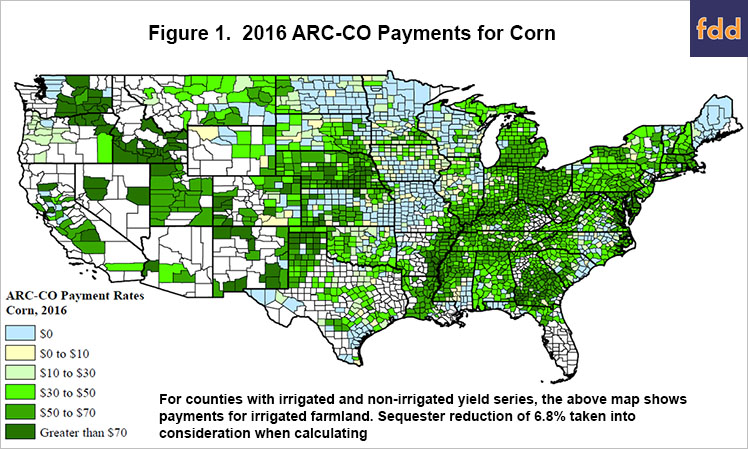
Figure 1 shows a map of 2016 ARC-CO payments for corn across the United States. As with all the figures in the article, payments are adjusted for the fact that payments are received on .85 of the base acres. In counties where non-irrigated and irrigated payments exist, the irrigated ARC-CO payment is reported. IF the county is not shaded, FSA did not report a yield for that county, most likely because no farms were enrolled in ARC-CO. As can be seen in Figure 1, payments will be received for many counties in states that border the Ohio River and lower Mississippi River. Many counties along the eastern seaboard will receive payments. Payments are also prevalent in Nebraska, but fewer counties will receive payments in Illinois, Iowa, Missouri, Minnesota, and Wisconsin.

2016 ARC-CO Payments for Soybeans
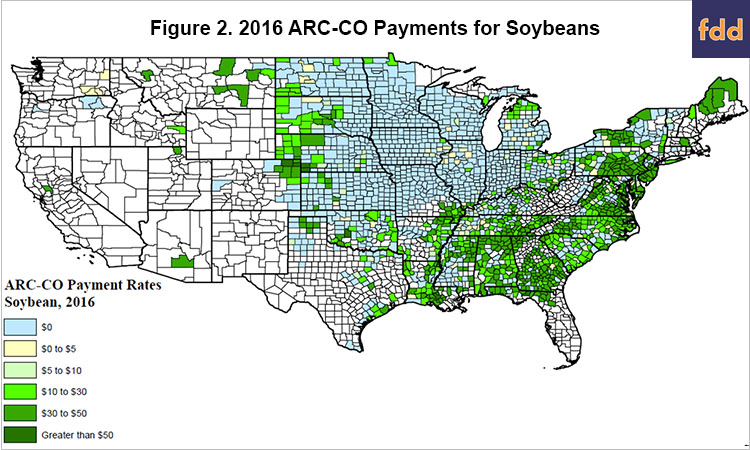
Most counties in the Midwest will not receive payments for soybeans. Payments are more prevalent in the eastern United States.

2016 ARC-CO Payments for Wheat
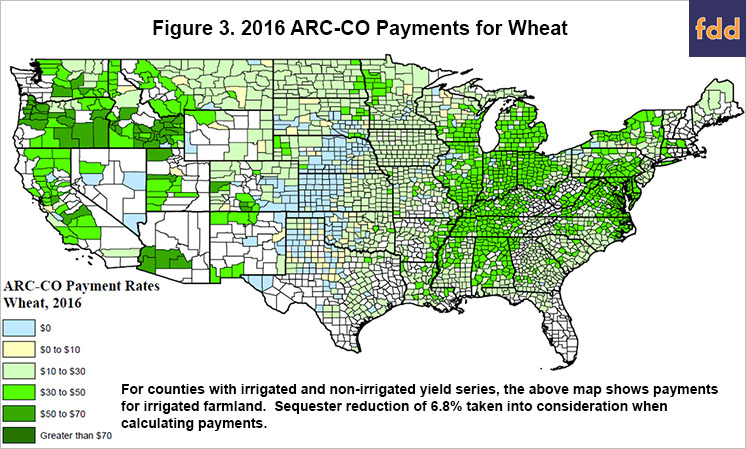
Many counties around the United States will be receiving payments for wheat (see Figure 3). Payments will be received in many counties east of the Mississippi and in the western United States. ARC-CO will not make payments in western Kansas, western Oklahoma, and the panhandle of Texas. High county yields in these areas offset the 2016 MYA price being below the 2016 benchmark price.

Illinois ARC-CO Payments
Table 1 shows per acre payments by county in Illinois. These payments are given per base acre for corn, soybeans, and wheat. These are per base acre and have been adjusted for the 6.8% sequester. Take Piatt County as an example. Land owners and farmers in Piatt County will receive $31 per corn base acre. If a farm has 50 base acres of corn, it would receive $1,550 in ARC-CO payments on that corn base.

Commentary
With the release of final county yields by FSA, ARC-CO payments for many counties can be calculated. Because average yields vary by county both for the 2016 crop and the 2011-2015 crops that determine the benchmark yield, there will be variability in ARC-CO payments across the counties. Those counties that had high 2016 yields relative to their benchmarks will not receive payments. Higher payments will be received for counties with low county yields relative to their benchmark yields.
References
Coppess, J., and N. Paulson. "Agriculture Risk Coverage and Price Loss Coverage in the 2014 Farm Bill." farmdoc daily (4):32, Department of Agricultural and Consumer Economics, University of Illinois at Urbana-Champaign, February 20, 2014.
Disclaimer: We request all readers, electronic media and others follow our citation guidelines when re-posting articles from farmdoc daily. Guidelines are available here. The farmdoc daily website falls under University of Illinois copyright and intellectual property rights. For a detailed statement, please see the University of Illinois Copyright Information and Policies here.


