


What is My Sustainable Growth Rate?
There are numerous motivations for farms to expand their businesses. Even in today’s environment of tight margins, many farms are exploring expansion options. When exploring these options, it is important to address key questions pertaining to the farm’s strategy. A previous article (farmdoc daily August 5, 2016) discussed ten questions that should be addressed when examining challenges and opportunities associated with farm growth. This article focuses on the tenth question: what is my sustainable growth rate?
Sustainable Growth Rate
The sustainable growth rate is the maximum rate of growth that a farm can sustain without having to increase financial leverage or look for outside financing. A farm’s sustainable growth rate can be computed as follows:
- (1) SGR = (NFI – OwnW) / NW
where SGR is the sustainable growth rate, NFI is net farm income, OwnW is owner withdrawals (e.g., family living expenses), and NW is owner’ equity or net worth. The right-hand side of equation (1) uses the same formula as that used to compute return on equity (ROE) for farms. Return on equity (ROE) is computed by subtracting owner withdrawals from net farm income and dividing by average owner’s equity or net worth. Net farm income minus owner withdrawals represents retained earnings. Increases in retained earnings increase a farm’s sustainable growth rate. Note that SGR and ROE do not include capital gains on land.
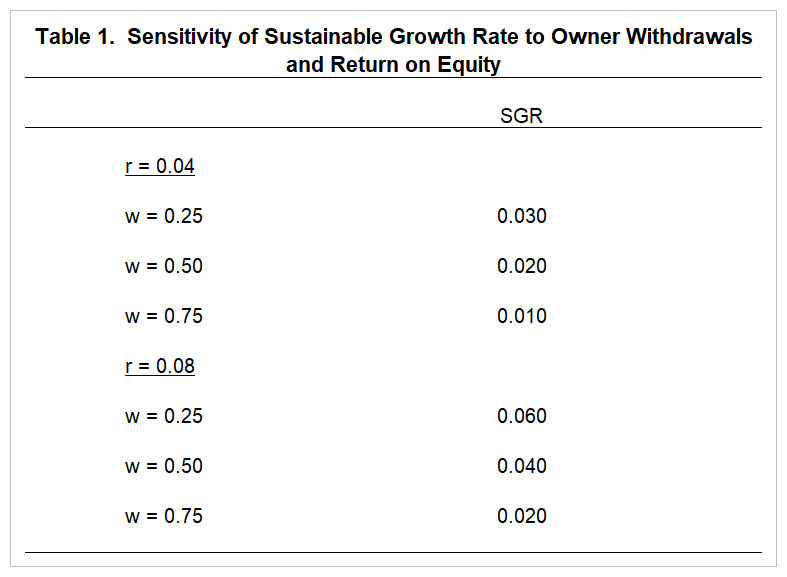
Table 1 illustrates the sensitivity of the sustainable growth rate (SGR) to changes in net farm income in relation to net worth (r) and the proportion of net farm income withdrawn from the business (w). The sustainable growth rate ranges from 0.01 (1 percent) for an r value of 4 percent and a w value of 75 percent to 0.06 (6 percent) for an r value of 8 percent and a w value of 25 percent.
The DuPont Financial Analysis model (Langemeier, 2016b) can be used to decompose return on equity into its components. This decomposition provides insight into the impact of the operating profit margin, asset turnover ratio, and financial leverage on return on equity and the sustainable growth rate. The specific computation is as follows:
- (2) SGR = {(OPM x ATR) x (Assets/Equity) x (Debt Burden)}
where OPM is the operating profit margin ratio, ATR is the asset turnover ratio, and assets and equity represent total average farm assets and owner’s equity, respectively. The operating profit margin ratio is computed by adding interest expense and subtracting owner withdrawals from net farm income and dividing the result by gross revenue. The asset turnover ratio is computed by dividing gross revenue by average total assets. The debt burden is computed by dividing net farm income minus owner withdrawals by net farm income minus owner withdrawals plus interest expense. It is important to note that multiplying OPM by ATR results in the return on assets.
Table 2 illustrates the sensitivity of the sustainable growth rate (SGR) to changes in financial performance (i.e., changes in r). The results were set up to be identical to those in table 1. Table 2 is used to illustrate the details regarding the components of return on equity. Several assumptions were made to generate the results in table 2. First, an asset turnover ratio of 0.25 or 25 percent was used. Second, the interest expense ratio was assumed to be 5 percent. Third, a debt to asset ratio of 0.25 (i.e., an asset to equity ratio of 1.33) was used for both the low and high financial performance scenarios (r=0.04 and r=0.08).
Note that the operating profit margin ratio (OPM) and the debt burden differ among the scenarios outlined in table 2. The operating profit margin depends on r (net farm income divided by owner equity) and the proportion of net farm income used for owner withdrawals (w). The debt burden increases as r increases, and decreases as w increases.
Two key points can be garnered from the results in table 2. First, even if the owner withdrawal rate is relatively low (e.g., w=0.25), a farm with low financial performance will have a relatively low sustainable growth rate. Second, a farm with a high financial performance and a relatively high owner withdrawal rate (e.g., w=0.75) will also have a relatively low sustainable growth rate. These results suggest that a farm’s sustainable growth rate is driven by the level of financial performance as well as the owner withdrawal rate or retained earnings.

Impact of Leverage on Farm Growth
Our discussion of farm growth rates would be incomplete without at least a brief discussion of the impact of leverage on farm growth. Financial leverage or debt influences a farm’s growth rate through its effect on expected returns and risk. The impact of financial leverage on a farm’s return on equity and sustainable growth rate depends on the relationship between return on assets and the interest rate on borrowed funds. As long as a farm’s return on assets is larger than the interest rate on borrowed funds, financial leverage will increase the return on equity and the sustainable growth rate, but higher financial leverage leads to an increase in financial risk. Specifically, as financial leverage increases, the potential loss of equity increases, the variation in expected returns to equity increases, and liquidity provided by credit reserves (the difference between a farm’s operating line limit and operating funds borrowed) lessens. The owner withdrawal rate has an impact on both expected returns and risk. As the owner withdrawal rate increases, expected returns decrease and financial risk increases.
Additional information on the impact of leverage on farm growth can be found in Barry and Ellinger (2012), and Langemeier (2016a). These two publications contain specific numeric examples related to the impact of leverage on expected returns and risk.
Concluding Thoughts
A farm’s sustainable growth rate depends on the farm’s return on equity and its components. A farm with a higher profit margin, a higher asset turnover ratio, a higher ratio of assets/equity, and/or a lower percentage of owner withdrawals to net farm income will have a higher sustainable growth rate. Leverage or the use of debt usually increases expected returns and risk. When a farm’s return on assets is higher than the interest rate on borrowed funds, increases in financial leverage will increase the rate of growth of equity. Conversely, when a farm’s return on assets is less than the interest rate, increases in financial leverage will reduce the rate of growth of equity.
References
Barry, P.J. and P.N. Ellinger. Financial Management in Agriculture, Seventh Edition. Upper Saddle River, New Jersey, Prentice-Hall, 2012.
Boehlje, M., and M. Langemeier. "Farm Growth: Challenges and Opportunities." farmdoc daily (6):148, Department of Agricultural and Consumer Economics, University of Illinois at Urbana-Champaign, August 5, 2016.
Langemeier, M. "Leverage and Financial Risk." farmdoc daily (6):28, Department of Agricultural and Consumer Economics, University of Illinois at Urbana-Champaign, February 12, 2016.
Langemeier, M. "Du Pont Financial Analysis." farmdoc daily (6):77, Department of Agricultural and Consumer Economics, University of Illinois at Urbana-Champaign, April 21, 2016.
Disclaimer: We request all readers, electronic media and others follow our citation guidelines when re-posting articles from farmdoc daily. Guidelines are available here. The farmdoc daily website falls under University of Illinois copyright and intellectual property rights. For a detailed statement, please see the University of Illinois Copyright Information and Policies here.