Gambling on Exports: A Review of the Facts on U.S. Agricultural Trade
The outlook for trade has darkened considerably in recent days; a gamble in the trade arena that holds substantial risk for American farmers. In May, President Trump initiated a trade investigation on automobiles that held the potential for triggering tariffs on imported cars and trucks (Swanson and Tankersley, May 24, 2018). On June 1st, the long-threatened tariffs on steel (25%) and aluminum (10%) went into effect for important U.S. trading partners (Mexico, Canada and the European Union), who quickly responded with threats or tariffs on U.S. exports; Mexico, in particular, imposed tariffs on $3 billion worth of American exports, including agricultural commodities and products (Swanson and Tankersley, June 5, 2018). Adding confusion to the concern, President Trump claimed that U.S. farmers haven’t been doing well for the last 15 years, and suggested that Canada, China, and Mexico have been treating U.S. farmers unfairly with “big trade barriers” (Sieff, June 5, 2018). These recent twists in the trade discussions call for further examination of the facts and potential risks, beginning with the data for the last 28 years, back to 1990 and the precursor to NAFTA—the Canada-U.S. Free Trade Agreement.
The Data
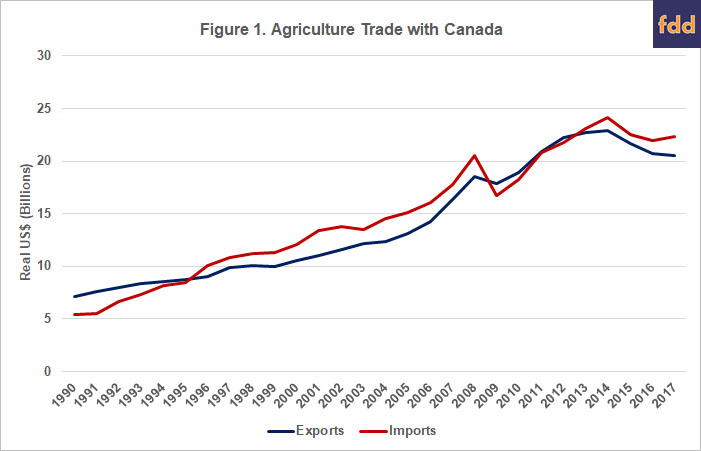
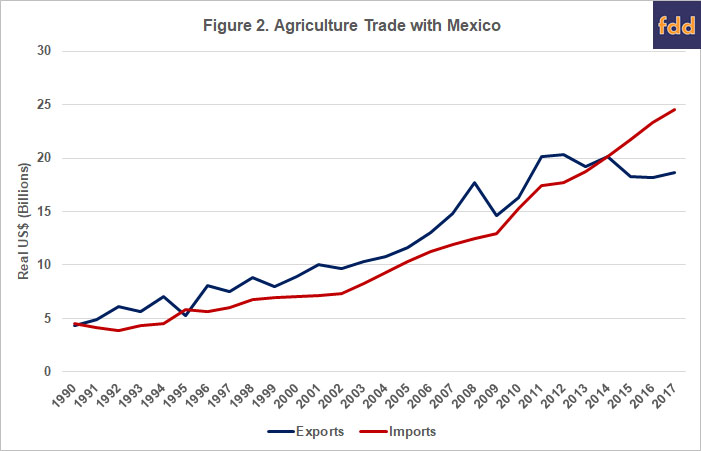
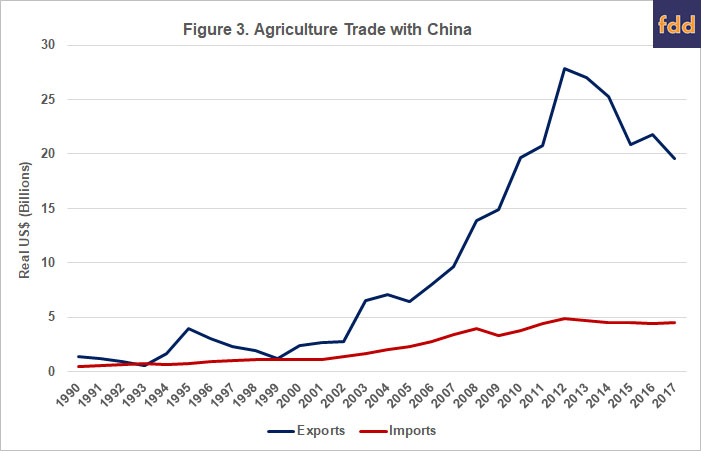
Trade data on imports and exports were obtained through the USDA Foreign Agricultural Service’s Global Agriculture Trade System (USDA FAS, GATS). To compare trade across time, we converted all import and export data to real values (2017 dollars), using the gross domestic product implicit price deflator obtained from the economic research of the Federal Reserve Bank of St. Louis (FRED). Figures 1, 2, and 3 below show agriculture imports and exports between the U.S. and Canada, Mexico, and China.
Discussion
The above figures make it clear that NAFTA and the loosening of Chinese trade restrictions have led to dramatic growth in U.S. agricultural exports. It is also clear that, in the case of our NAFTA partners, agricultural imports have also grown. In addition, where there are trade deficits with our NAFTA partners on agricultural products, they are relatively small, particularly in comparison to total trade volume.
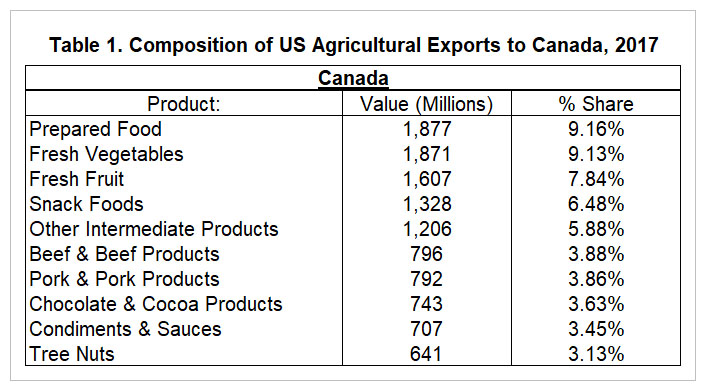
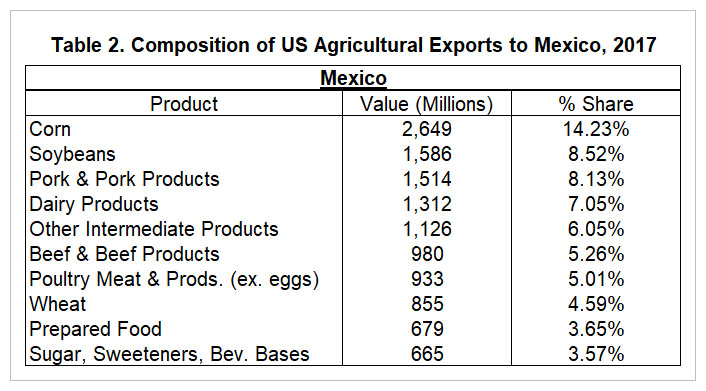
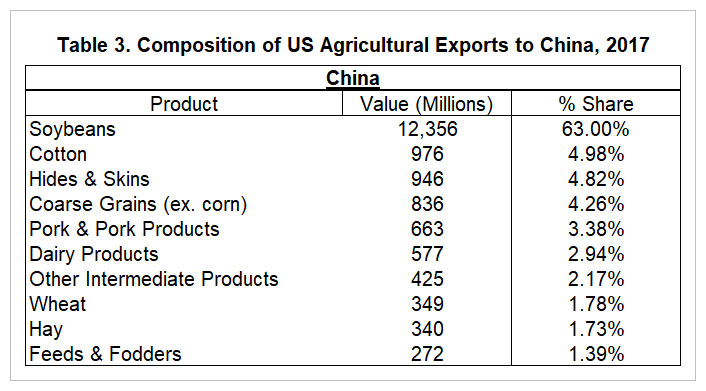
In general, the U.S. exports different agricultural products to these three countries than it imports, reflecting our relative comparative advantages for those products relative to our trading partners. In 2017, the U.S. exported to Canada: prepared foods (9.16% of the value of all US agricultural exports to Canada), fresh vegetables (9.13%), fresh fruit (7.84%), snack foods (6.48%), beef (3.88%), pork (3.86%), and chocolate & cocoa products (3.63%). U.S. exports to Mexico were made up of corn (14.23% of the value of all agriculture exports to Mexico), soybeans (8.53%), pork (8.13%), dairy (7.05%), beef (5.26%), poultry meat (5%), and wheat (4.59%). U.S. exports to China are primarily made up of soybeans (63% of the value of all US agricultural exports to China), followed by cotton (5%), non-corn coarse grains (4.26%), pork (3.38%), dairy (3%). Tables 1, 2, and 3 lists the top-ten U.S. agricultural exports by value and their relative share of total U.S. agriculture exports to each country.
Notably, the above figures indicate that over the last three to five years the U.S. has experienced an agriculture trade deficit with both Canada and Mexico. There are several reasons why trade gaps may widen, one of which could be due to trade barriers. However, these deficits are not the result of increased, or “big trade barriers.” There are barriers to U.S. agricultural exports to Canada in terms of dairy, eggs and poultry, but those are not new and have been around before NAFTA. The U.S. also continues to implement import barriers of their own, most notably, for sugar.
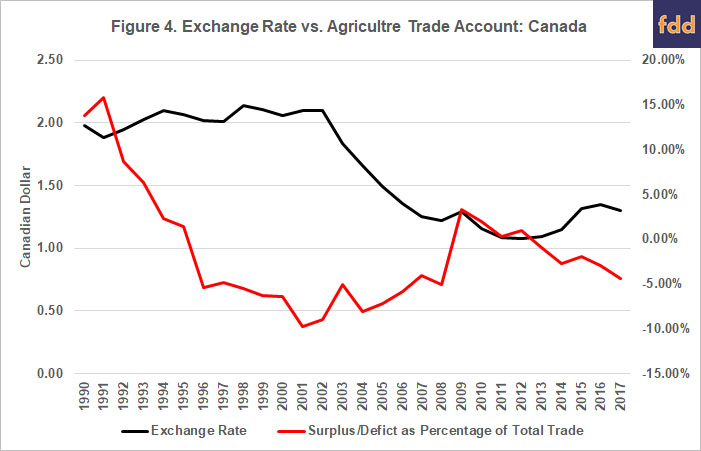
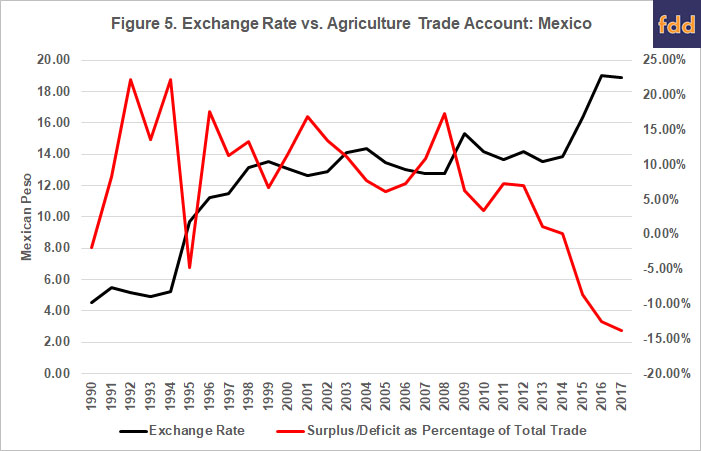
Trade barriers are less of an issue in any deficits for agricultural trade than the increasing strength of the U.S. dollar. As discussed in an earlier article, a strengthened dollar will tend to lead to trade deficits (farmdoc daily, April 4, 2018). A stronger dollar results in U.S. exports becoming more expensive (because they have to be paid in USD), and imports from other countries (paid for in the importing county’s currency) are cheaper, as a strong dollar buys more of the importing currency.
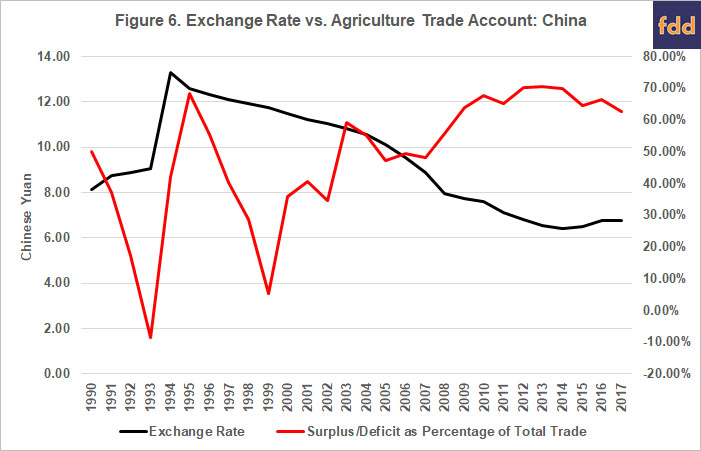
Figures 4, 5, and 6 compares the exchange rate versus U.S. agricultural surpluses or deficits as a percentage of total agriculture trade with a nation. Except China, who sets a fixed exchange rate and doesn’t allow for their currency to be freely traded on an exchange—which led to an undervaluation of their currency earlier, but if anything a potential overvaluation now (Krugman, August 13, 2015)—both Canada and Mexico’s exchange rates exhibit almost perfect negative correlation with our agricultural trade surplus and deficit. Meaning as the dollar strengthens: imports increase, and as the dollar weakens: imports decrease (exports increase).
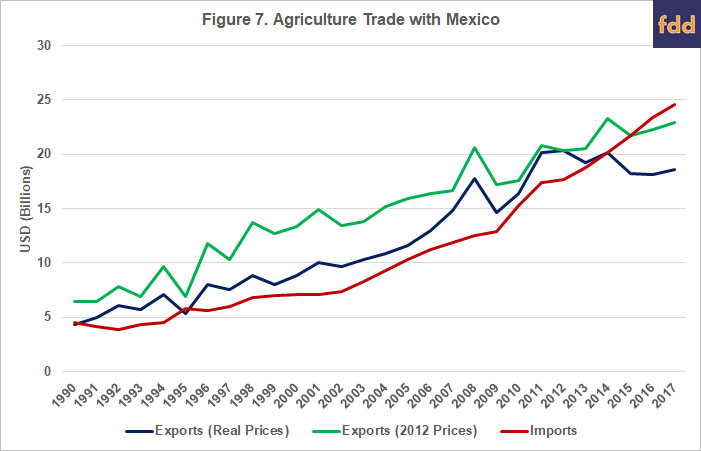
Another reason that the trade gap has widened in the last few years is due to a drop in prices of primary U.S. agricultural exports: grains and oilseeds. As is expected, the value of total U.S. agricultural exports of these commodities mirror the fluctuations in these prices. To demonstrate that world prices matter for trade, figure 7 estimates the value of exports to Mexico if the U.S. received 2012 prices (an all-time high) for corn, soybeans, and wheat exports. As you can see, if the U.S. experienced 2012 price levels for those three commodities the deficit with Mexico would be significantly smaller. In fact, at 2012 prices, the deficit nearly goes away, with an almost 80% reduction in 2016, and a 73% reduction in 2017. It’s also important to note that these export values are an underestimate, as higher grain prices would also increase the prices of meat exports that rely on grains as feed, further increasing the value of US exports.
While the few long-standing agricultural trade barriers have not led to recent agricultural trade deficits, retaliatory tariffs in response to U.S. tariffs on steel and aluminum, and potential tariffs on automobiles, raise significant risks for American agriculture. Agriculture often bears the cost of retaliation in trade disputes (farmdoc daily, October 4, 2017). Canada, Mexico, and the EU have already announced retaliatory tariffs on U.S. agriculture in response to U.S. implementation of steel and aluminum tariffs last week. Mexico’s tariffs went into effect on June 5th, with pork and hard, shredded or powdered cheeses seeing a 10% rate until July 5th when the rate increases to 20%. Canada and the EU’s tariffs will go into effect starting in July.
The steel and aluminum tariffs imposed by the U.S. are particularly disconcerting to our trade partners because of the justification used by President Trump: a claim of impairment to our national security. This national security clause is known as Section 232, and is an investigation conducted under the authority of the Trade Expansion Act of 1962 which seeks to determine the effect of imports on national security. If the Secretary of Commerce finds that imports threaten to impair national security, the President can use his authority to adjust imports by implementing tariffs or other barriers.
Since 1962, only 26 cases have been initiated under Section 232, nearly one-third of which have been petroleum (crude and refined). Of the 26 cases presented to the President, only three were deemed to be a threat to national security, and the President took action, of which, President Carter’s oil fee in response to a 1978 inquiry was deemed illegal, and removed. Two cases were deemed a threat and the President took no action (President Clinton on petroleum in 1995 and 2000), and only one case was found not to be a threat to national security and the President still took action (President Reagan, ferroalloys in 1982).
If the U.S. is to continue to take unprecedented action in its use of the national security clause to protect automobiles, along with the legal retaliatory tariffs allowed under the WTO, we risk establishing a precedent for other countries to make a ‘national security’ claim to protect their industries and that may well focus on agricultural products. This could cause further problems for U.S. agriculture at a time of relatively low prices and farm income (farmdoc daily, March 21, 2018).
Concluding Thoughts
The trade data make it clear that over the past 15 years, the value of U.S. agricultural exports has expanded dramatically with our three largest agricultural trading partners: China, Canada and Mexico. While a few lingering trade barriers among these countries remain in place, most have been dramatically lowered over the last 15 years, helping facilitate this substantial increase in trade. Where trade deficits for agricultural products occur with Canada and Mexico, they are small relative to the total value of agricultural trade, can largely be attributed to the rise in the value of the U.S. dollar, and the drop in the price of some of our key exports. The real threat to agricultural exports now comes from rising trade tensions with all three of these countries who are our largest agricultural markets. In particular, the imposition of steel and aluminum tariffs, and potentially tariffs on automobiles, in the name of the rarely-used ‘national security’ clause, opens the door to a potentially large number of retaliatory tariffs, hurting our export-dependent industries such as U.S. agriculture.
References
Baylis, K., S. Burak, and J. Coppess. "Why They Can't All Be Trade Surpluses." farmdoc daily (8):59, Department of Agricultural and Consumer Economics, University of Illinois at Urbana-Champaign, April 4, 2018, https://farmdocdaily.illinois.edu/2018/04/why-they-cant-all-be-trade-surpluses.html
Burak, S., K. Baylis, and J. Coppess. "US Agriculture Often Bears the Cost of Trade Disputes." farmdoc daily (7):181, Department of Agricultural and Consumer Economics, University of Illinois at Urbana-Champaign, October 4, 2017,https://farmdocdaily.illinois.edu/2017/10/us-agriculture-often-bears-cost-of-trade-diputes.html
Sieff, K., “Trump suggests that U.S. farmers are facing big trade barriers in Mexico. They have actually fallen,” The Washington Post, June 5, 2018, https://www.washingtonpost.com/news/worldviews/wp/2018/06/05/trump-suggests-u-s-farmers-face-big-trade-barriers-in-mexico-they-have-actually-fallen/?noredirect=on&utm_term=.aba6958fe3e8
Swanson, A. and J. Tankersley, “Potential Auto Tariffs Prompt Warnings From Industry and Allies,” The New York Times, May 24, 2018, https://www.nytimes.com/2018/05/24/us/politics/trump-auto-tariffs-trade.html?action=click&module=RelatedCoverage&pgtype=Article®ion=Footer
Swanson, A. and J. Tankersley, “Mexico, Hitting Back, Imposes Tariffs on $3 billion Worth of U.S. Goods,” The New York Times, June 5, 2018, https://www.nytimes.com/2018/06/05/us/politics/trump-trade-canada-mexico-nafta.html
Zulauf, C., G. Schnitkey, J. Coppess, and N. Paulson. "U.S. Field Crop Income - Return to Normalcy." farmdoc daily (8):50, Department of Agricultural and Consumer Economics, University of Illinois at Urbana-Champaign, March 21, 2018, https://farmdocdaily.illinois.edu/2018/03/us-field-crop-income-return-to-normalcy.html
Disclaimer: We request all readers, electronic media and others follow our citation guidelines when re-posting articles from farmdoc daily. Guidelines are available here. The farmdoc daily website falls under University of Illinois copyright and intellectual property rights. For a detailed statement, please see the University of Illinois Copyright Information and Policies here.


