Understanding Budget Implications of Cover Crops
Farmers remain under pressure to adopt practices that will reduce nutrient losses from their fields and cover crops are considered the most effective in-field practice for reducing nitrogen and phosphorus losses (farmdoc daily, July 6, 2016; Illinois NLRS, 2015). As the benefits of adopting cover crop practices become better known and understood, including for nutrient loss reduction and soil health, adoption rates are improving but continue to remain low (SARE, 2013). Cover crops add cost and management challenges for a farm operation, which can be additionally problematic given recent years of lower crop prices and difficult farm finances (farmdoc daily, March 6, 2018). This article seeks to add perspective on cover cropping practices by reviewing costs of the practice from a farm budget perspective.
Background
While cover crops are understood to provide benefits to farming, the economic value of the benefits can be difficult to measure and may be overlooked in a farm budget. For example, research has consistently found that cover crops are beneficial to soil health and the environment as roots help prevent soil erosion by stabilizing the soil and controlling runoff (Coppess 2018; SARE 2013). Both roots and top growth can serve as a natural compost, adding organic matter and nutrients to the soil. Cover crops stimulate growth of beneficial microbes that aid in control of pests and diseases. Some cover crops physically suppress weeds with a dense cover while others have an allelopathic effect on weed seeds. Cover crop legumes fix Nitrogen in the soil and can provide a Nitrogen credit for the following cash crop. Cover crops, especially those that survive over winter, are nutrient scavengers, with the ability to retrieve Nitrogen deep in the soil that would have otherwise been susceptible to leaching and loss. The range of benefits to soil health from cover crops also holds potential for improving yields when incorporated into a row crop farming system and properly managed.
One popular cover crop is cereal rye because it is relatively inexpensive, easy to establish, and provides substantial biomass. As a nutrient scavenger, cereal rye uses a deep fibrous root system to capture excess Nitrogen, keeping them from reaching ground water or running off with surface water. Scavenged nutrients are available in the residual biomass for use by the following cash crop. Another cover crop example is hairy vetch, a nitrogen producing legume. It has the ability to enrich the soil with additional nutrients through nitrogen fixation. Researchers have found that cereal rye pairs well with hairy vetch for a cover crop mixture that holds excess soil nitrate, fixes nitrogen, protects against erosion, and covers well to control weeds.
Discussion
For an average grain farm in Central Illinois, 2018 non-land costs are expected to be $563 per acre for corn and $354 per acre for soybeans (farmdoc daily, June 21, 2018). Costs at this level result in a net loss of $89 per acre for corn and a net loss of $13 per acre for soybeans. In this tight margin environment, a farmer may not find it feasible to take on additional expenses to implement cover crops.
Cover Crop Costs
The direct costs to establish a cover crop include the seed and planting cost. Seed cost, a significant portion of total cost, is dependent on the seed selected, seeding rate, and the cost of seed. Aerial seeding as a planting method is likely costlier than drilling, but allows for more flexibility in timing, including seeding into the standing crop before harvest. While this budget analysis will focus on seed and planting cost, it is notable that cover crops may result in additional expenses or potential cost savings, depending on existing farm tillage and herbicide practices (farmdoc daily, July 6, 2016). For this analysis we assume costs of tillage and herbicide practices are not changed as a result of adding cover crops.
Although prices vary by season, establishment cost for 2018 is estimated in Table 1. Drilling costs are taken from the 2017 Machinery Cost Estimates and equal $13.40 per acre. Researchers generally recommend drilling cereal rye at 60-120 pounds per acre (SARE 2013). When combined with hairy vetch, the recommendation is for a seeding rate containing 15-25 pounds per acre of hairy vetch with 40-70 pounds per acre of cereal rye. For this discussion, we examine cereal rye at 60 pounds and a blend of 15 pounds of hairy vetch and 45 pounds of cereal rye. Seed costs are estimated at $0.25 per pound for cereal rye and $2.24 per pound for hair vetch. Given these parameters, the establishment costs for the central Illinois farm are $28.40 per acre for cereal rye and $58.25 per acre for the rye/vetch blend.

Potential Cost Savings
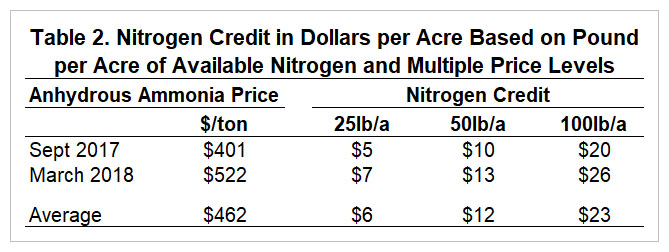
Cover crops can provide addition nitrogen to the following cash crop, either through scavenging residual nitrogen (e.g., cereal rye) or fixing from the atmosphere (e.g., legumes). Producers should be able capture some of this fertilizer benefit by adjusting their Nitrogen application rate. Cereal rye can typically scavenge and hold 25-50 pounds of Nitrogen per acre (SARE). A full seeding of hairy vetch can provide 40-200 pounds per acre of available Nitrogen for cash crop production (Lu et al., 2000). A mixture of cereal rye and hairy vetch may provide a Nitrogen credit of 50-100 pounds per acre before a corn crop (SARE 2013).
Nitrogen fertilizer prices are needed to translate the credit from pounds per acre to dollars per acre. The price for anhydrous ammonia increase from $401 per ton in September 2017 to $522 per ton in March 2018 (farmdoc daily April 3, 2018). Given the 2018 seasonal costs and range of estimated nitrogen credits, we assume cereal rye provides a Nitrogen credit of $5-$13 per acre while a rye/vetch blend provides a credit of $10-$26 per acre, as shown in Table 3. Assuming an average price and midpoint credit in the budget, we used a credit of $9 per acre for cereal rye and a credit of $18 per acre for the rye/vetch blend.
Budget Comparison
The baseline budget for 2018 corn on a central Illinois farm is shown in the first column of Table 3 below. The table compares the baseline budget to the same farm level budget with adjustments made to reflect the costs of establishing a cereal rye cover crop and a rye/vetch cover crop blend, and a view of the budget when the average Nitrogen credit offsets fertilizer cost.
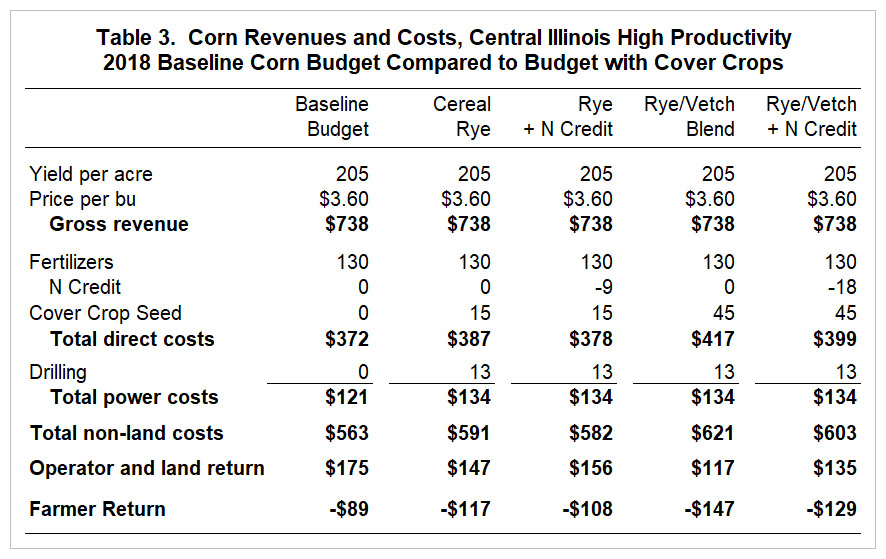
Establishing a cover crop increases total cost at the farm level. On an average Central Illinois farm, a cereal rye cover crop increases non-land costs by 5% from $563 to $591 per acre. The rye/vetch blend pushes non-land costs up to $621, approximately 10% above the baseline. In this analysis cost increases due to the cost of cover crop seed and the cost to drill it. Additional costs may include an extra pass through the field to drill the cover crop, but in this analysis we assume the farmer is already applying a spring chemical application for weeds that could also include the herbicide treatment for chemical termination of the cover crop. When a farmer utilizes the Nitrogen credit and reduces Nitrogen application, fertilizer costs are reduced. The Nitrogen credit partially offsets the cost of establishing a cover crop, leaving the farmer with a 3.4% increase in non-land costs when seeding cereal rye or a 7.1% increase when seeding a rye/vetch blend.
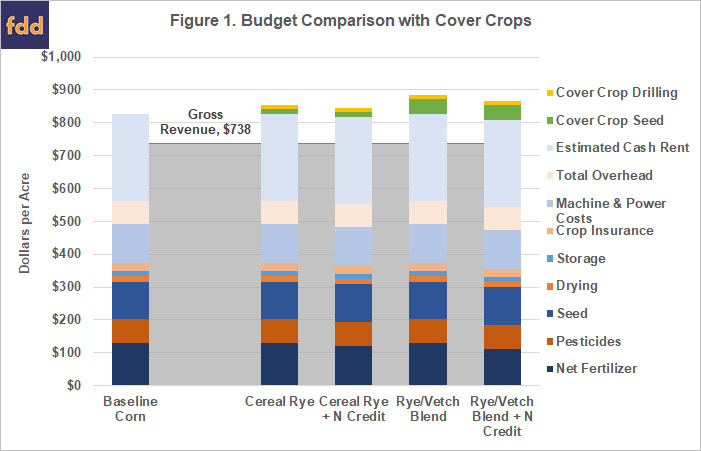
Figure 1 illustrates the budget comparison for the figures in Table 3, comparing costs and additional costs for cover crops (or N credit) with the baseline budget and gross revenues for corn. Figure 1 highlights the budgetary challenges for cover crop adoption in a situation where the farmer is already struggling financially to cover costs.
Impacts on Financial Health & Income
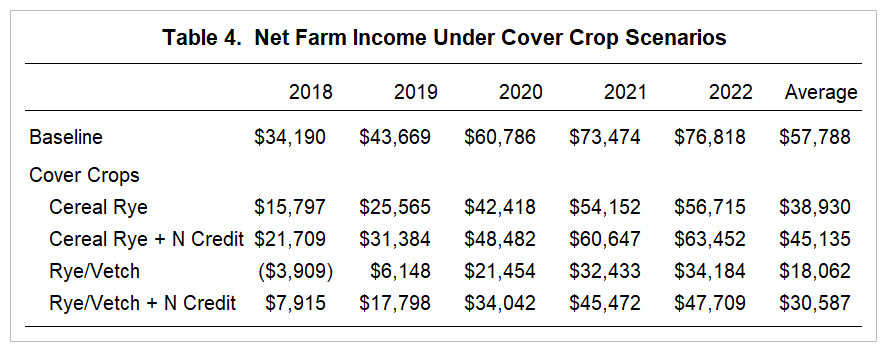
To evaluate the economics of cover crops at the farm level the Gardner Farm Income and Policy Simulator (GFIPS) and central Illinois high productivity case farm are used to compare the four cover crop budgets in Table 3 to the baseline. In this analysis the cover crop practice is a winter cover crop preceding corn acres, so the blend is assumed to be seeded preceding only corn acres for the 2018 through 2022 crop years.
Form 2018-2022 the average baseline net farm income is $57,788. Under the cover crop simulation average net farm income ranges from a high of $45,135 in the cereal rye plus Nitrogen credit scenario down to $18,062 in the scenario where the farm plants a rye/vetch blend but does not reduce Nitrogen application (see Table 4).
Under the baseline, the average $57,788 net farm income results in a relatively stable financial position with continued weakened in debt positions and decreasing net worth. Net worth for the farm equaled $3.66 million at the end of 2017. Under the baseline without cover crops, net worth at the end of 2022 would be reduced to $3.53 million (see Table 5). The current ratio would be 1.59 at the end of 2022, equivalent to the ratio value at the end of 2017. The operation generates sufficient funds to cover its debt obligations, as indicated by the debt coverage ratio of 114.8%, higher than 100% when the operation is providing enough funds to cover debt obligations. Debt relative to assets, however, does increase over the projection period, as indicated by the increase in debt-to-asset ratio from 25.9% at the end of 2017 to 27.6% at the end of 2022.
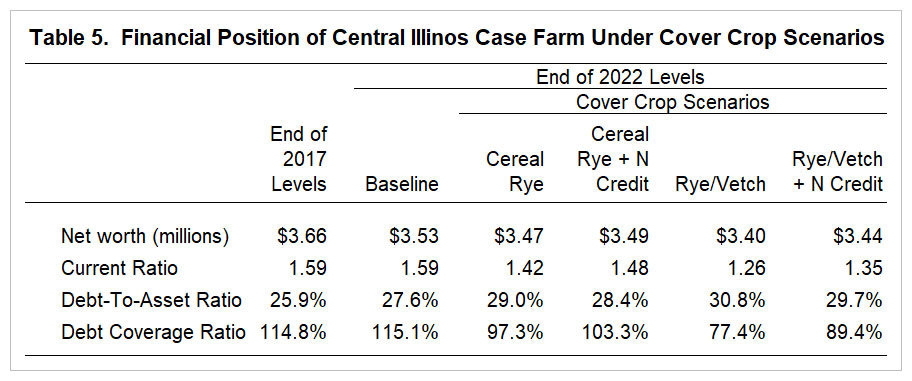
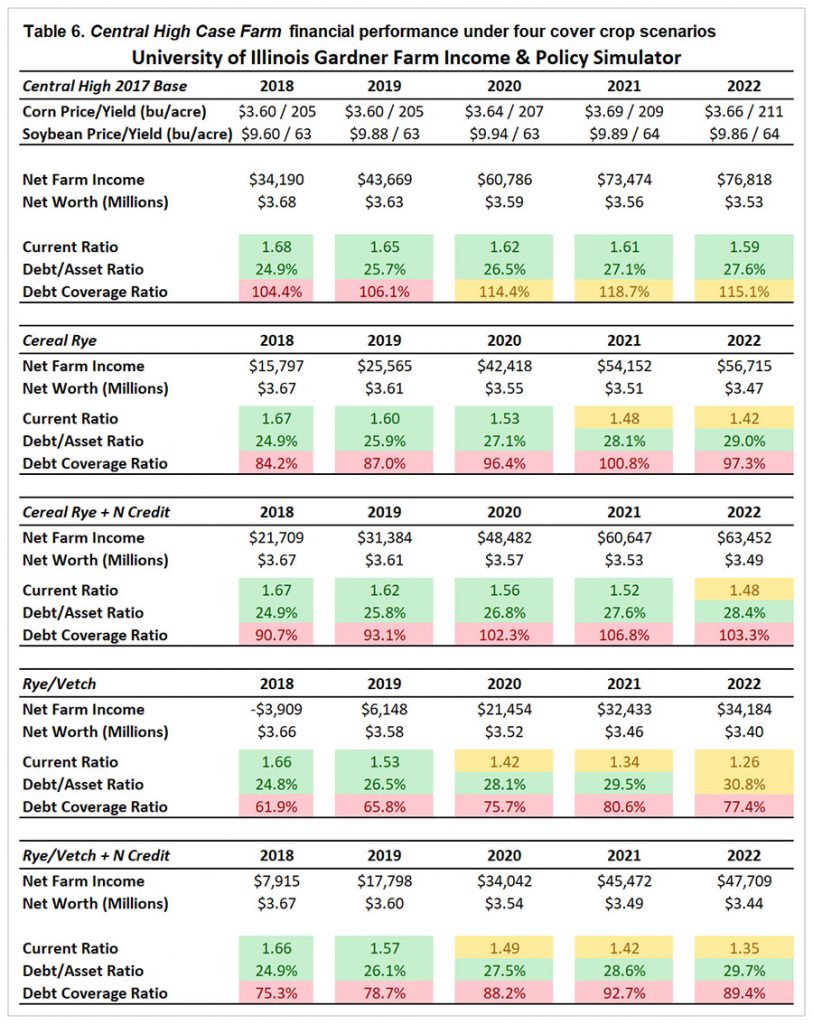
Adding cover crops to the row crop farming system would increase the financial deterioration. Table 5 includes end-of-2022 balance sheet values for all of the budgeted cover crop scenarios (see appendix for values of the current ratio, debt-to-asset ratio, and debt coverage ratio over time). Considering the most budget friendly option (cereal rye with a Nitrogen credit), net worth declines to $3.49 million in 2022, an additional $41,904 loss over the baseline scenario. Working capital is further weakened leading to a current ratio of 1.48 and debt coverage ratio would be 103.3%. Although above the 100% threshold for meeting debt obligations, these levels indicate cash flow issues. Debt-to-asset ratio is projected to be 28.4% at the end of 2022.
Conclusion/Further Research
The costs to establish a cover crop likely remain the strongest factor in a farmer’s decision to adopt the practice and the discussion herein provides important perspective on that matter. In the overall farm budget, the costs for establishing a cover crop are not overwhelming; $10 to $28 per acre (depending on N credit), an amount that is within the range of costs for crop insurance, drying or storage. Implementing a cover cropping system may increase non-land costs by 5-10% above the baseline budget, depending on whether N application is reduced to account for the credit for N available from the cover crop. Given an average cash rent, this would equate to a 2-7% increase in total costs. With a deteriorating farm financial position, however, these additional costs may complicate the decision to adopt the practice. Higher costs lead to lower net farm income and overall worsening financial position.
This analysis is only one part of the story and is incomplete because it focuses only on the budget implications (direct cover crop costs) for the farmer. There are at least two additional components to complete the analysis, beginning with valuation of the benefits of adopting cover crop practices; environmental benefits for water quality and the benefits to the farm in terms of potential yield improvements, reduced soil erosion and improved soil health. The policy implications also need to be analyzed, including how cost-share assistance impacts the budget implications and costs. From a policy perspective, analysis is needed to understand how policy can help address the challenges inherent in practices with short-term costs and long-term benefits, as well as the individualized costs to the farmer compared to the societal benefits to water quality and the environment. Future articles will cover these topics, updating budget implications from these additional benefits and policies.
References
“Machinery Cost Estimates: Field Operations.” Department of Agricultural and Consumer Economics, University of Illinois at Urbana-Champaign, June 2017. http://farmdoc.illinois.edu/manage/machinery/field_operations_2017.pdf
Bergtold, J.S., S. Ramsey, L. Maddy, J.R. Williams. 2017. “A review of economic considerations for cover crops as a conservation practice.” Renewal Agriculture and Food Systems.
Coppess, J. 2018. “A Perspective on Agricultural Policy in the Age of Nutrient Loss.” Drake J. of Agricultural Law, vol. 23.1 (forthcoming): 27-42.
Illinois EPA. “Illinois Nutrient Loss Reduction Strategy.” http://www.epa.illinois.gov/Assets/iepa/water-quality/watershed-management/nlrs/nlrs-final-revised-083115.pdf
Lu, Y.C., K.B. Watkins, J.R. Teasdale, A.A. Abdul-Baki. 2000. “Cover crops in sustainable food production.” Food Reviews International 16(2):121–157.
Roesch-McNally, G.E., A.D. Basche, J.G. Abruckle, J.C. Tyndall, F.E. Miguez, T. Bowman, R. Clay. 2017. “The trouble with cover crops: Farmers’ experiences with overcoming barriers to adoption.” Renewable Agriculture and Food Systems, 1-12. https://lib.dr.iastate.edu/nrem_pubs/206/
Roth, R.T., M.D. Ruffatti, P.D. O’Rourke, S.D. Armstrong. 2018. “A cost analysis approach to valuing cover crop environmental and nitrogen cycling benefits: A central Illinois farm case study.” Agricultural Systems 159 (2018), 69-77.
Schnitkey, G. "Has the Era of Decreasing Per Acre Corn Costs Come to an End?." farmdoc daily (8):114, Department of Agricultural and Consumer Economics, University of Illinois at Urbana-Champaign, June 21, 2018.
Schnitkey, G. "Nitrogen Prices, Rates Cuts, and 2018 Fertilizer Costs." farmdoc daily (8):58, Department of Agricultural and Consumer Economics, University of Illinois at Urbana-Champaign, April 3, 2018.
Schnitkey, G., J. Coppess and N. Paulson. "Costs and Benefits of Cover Crops: An Example with Cereal Rye." farmdoc daily (6):126, Department of Agricultural and Consumer Economics, University of Illinois at Urbana-Champaign, July 6, 2016.
Snapp, S.S., S.M. Swinton, R. Labarta, D. Mutch, J.R. Black, R. Leep, J. Nyiraneza, K. O’Neil. 2005. “Evaluating cover crops for benefits, costs and performance within cropping system niches.” Agronomy Journal 97:322–332.
Sustainable Agricultural Research and Education. 2013. Managing cover crops profitably: Third edition, http://www.sare.org/Learning-Center/Books/Managing-Cover-Crops-Profitably-3rd-Edition.
Sustainable Agriculture Research and Education. “2016 Cover Crop Survey Analysis.” https://www.sare.org/Learning-Center/From-the-Field/North-Central-SARE-From-the-Field/2016-Cover-Crop-Survey-Analysis
Swanson, K., G. Schnitkey, J. Coppess and N. Paulson. "Introducing the Gardner Farm Income and Policy Simulator." farmdoc daily (8):39, Department of Agricultural and Consumer Economics, University of Illinois at Urbana-Champaign, March 6, 2018.
Disclaimer: We request all readers, electronic media and others follow our citation guidelines when re-posting articles from farmdoc daily. Guidelines are available here. The farmdoc daily website falls under University of Illinois copyright and intellectual property rights. For a detailed statement, please see the University of Illinois Copyright Information and Policies here.


