Exploring Changes in the Current Ratio from 2006 to 2017
Recent farmdoc daily articles have examined trends in liquidity measures for farms in Illinois and Kansas (July 20, 2018 and August 10, 2018). In general, liquidity improved from 2007 to 2012, and then declined. This article used data from three farm management associations and USDA-ERS to further explore trends in the current ratio. In addition, differences in the current ratio among farms are examined.
To examine trends in the current ratio, data from the Illinois FBFM program, the Kansas Farm Management Association (KFMA), the University of Minnesota, and USDA-ERS were utilized. The Illinois FBFM data was reported in annual reports. The KFMA data included annual data for crop farms, crop/beef farms, and beef farms. The FINPIN database, generated by the Center for Farm Financial Management at the University of Minnesota, were used to obtain current ratio data over the sample period. It is important to note that data for all the farms in FINBIN, rather than data for a specific farm type, was utilized. Data for all U.S. farms were obtained from the USDA-ERS Farm Income and Wealth Statistics website.
Current Ratio Trends
The current ratio is computed by dividing current assets by current liabilities. Current assets include cash, accounts receivable, supply inventories, crop inventories, and market livestock inventories. Current liabilities include accounts payable, operating lines of credit, and the portion of non-current loans due within the next year.
Liquidity thresholds are typically used by analysts to determine whether a farm has an adequate liquidity position. A current ratio above 2.0 is considered adequate and would typically be sufficient to weather a one to two year downturn in margins. A farm with a ratio below 1.0 is not able to cover their current liabilities by selling all of their current assets, and therefore may have trouble repaying loans.
Table 1 reports the current ratio from 2006 to 2017 for the Illinois FBFM, KFMA, and FINBIN farms, and for all U.S. farms from 2009 to 2017. The Illinois FBFM, KFMA, and U.S. farm information represent annual averages. The FINBIN values represent median values. Current ratio information prior to 2009 was not available for all U.S. farms.

For all four data series the current ratio peaked in 2012. The Illinois FBFM and KFMA averages peaked at values above 3.0 while the peaks for farms in the FINBIN database and for all U.S. farms were below 3.0. Also, for all four of the data series, the current ratio dropped substantially from 2012 to 2017. It is important to note that the current ratios for Illinois FBFM farms, KFMA farms, and FINBIN farms are significantly correlated. In other words, they tend to have similar trends. The average current ratio in 2017 for Illinois FBFM and KFMA farms is at higher levels than that for the FINBIN farms and all U.S. farms. The median and average 2017 current ratios for the FINBIN farms and for all U.S. farms are substantially below the 2.0 threshold. In summary, for all four data series, the improvement in the current ratio experienced as a result of the large increase in ethanol production in 2007 has essentially disappeared.
Current Ratio Deciles for 2017
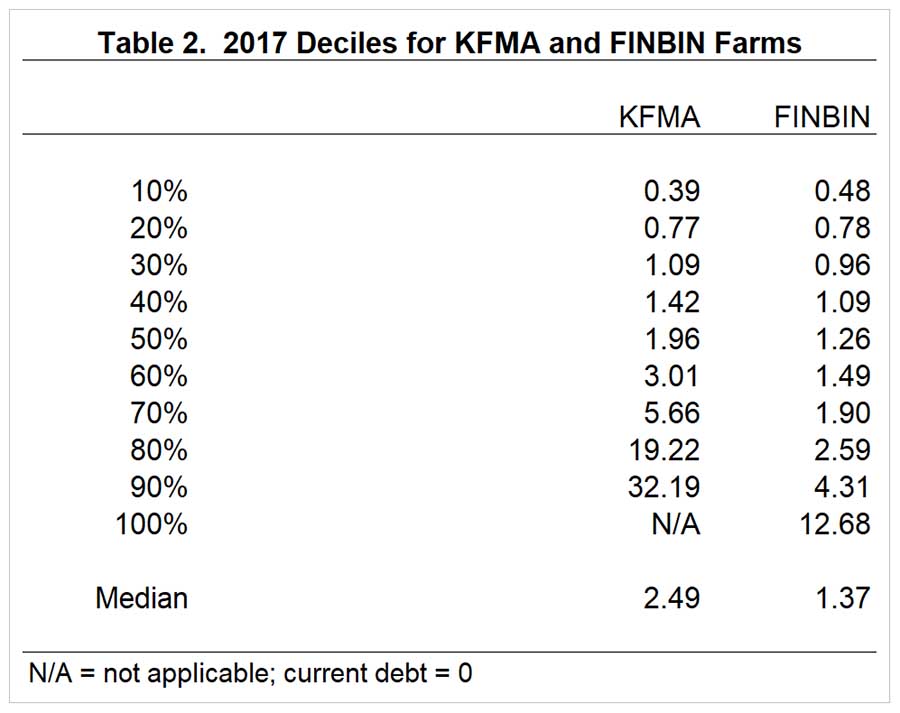
The discussion above examined trends in average and median current ratios from 2006 to 2017. These trends highlight the increase in farm liquidity up to 2012 and the subsequent decline in liquidity after 2012. However, using averages and median values does not provide insight into differences in liquidity among farms. Table 2 reports decile information for KFMA and FINBIN farms for 2017. The results in table 2 are rather sobering. Approximately 50 and 70 percent of the KFMA and FINBIN farms, respectively, have a current ratio below the 2.0 threshold. Even more disconcerting, 20 and 30 percent of the KFMA and FINBIN farms, respectively, were below the 1.0 threshold. Conversely, there were 40 and 10 percent of the KFMA and FINBIN farms, respectively, that had a current ratio above 3.0.

Concluding Comments
This article examined trends in liquidity for farms participating in farm management associations and for all U.S. farms. Liquidity, measured using the current ratio, has declined substantially since its peak in 2012. Using KFMA and FINBIN data, over 50 percent of the farms had a current ratio below 2.0, and from 20 to 30 percent of the farms had a current ratio below 1.0. These percentages illustrate the difficulty that large proportions of farms are having in repaying loans and covering current liabilities.
USDA-ERS projects that the average current ratio in 2018 for all U.S. farms will be 1.49, down from an average current ratio of 1.58 in 2017. In general, liquidity measures in 2018 will depend on a multitude of factors including crop prices and yields, weather, and other factors, all of which are inter-related. Using current futures prices adjusted for basis, trend yields, and projected government payments; we expect the percentage of farms below the critical liquidity thresholds to increase in 2018.
References
Langemeier, M. and A. Featherstone. "Examining Trends in Liquidity for a Sample of Kansas Farms." farmdoc daily (8):149, Department of Agricultural and Consumer Economics, University of Illinois at Urbana-Champaign, August 10, 2018.
University of Minnesota, Center for Farm Financial Management. FINBIN, https://finbin.umn.edu, accessed August 13, 2018.
USDA-ERS. Farm Income and Wealth Statistics web site, accessed August 23, 2018. https://data.ers.usda.gov/reports.aspx?ID=17835
Zwilling, B., B. Krapf and D. Raab. "Cash Is King – Revisited." farmdoc daily (8):134, Department of Agricultural and Consumer Economics, University of Illinois at Urbana-Champaign, July 20, 2018.
Disclaimer: We request all readers, electronic media and others follow our citation guidelines when re-posting articles from farmdoc daily. Guidelines are available here. The farmdoc daily website falls under University of Illinois copyright and intellectual property rights. For a detailed statement, please see the University of Illinois Copyright Information and Policies here.


