Operating Profit Margin Benchmarks
This article examines trends in the operating profit margin for a sample of farms over a ten-year period and develops financial performance benchmarks. Specifically, using KFMA whole-farm data for farms with continuous data from 2008 to 2017, the operating profit margin ratio is computed for each farm and year. In addition to developing a benchmark for the operating profit margin ratio, expense ratio benchmarks are discussed.
Benchmark Definitions
The operating profit margin ratio was computed by adding interest expense and subtracting unpaid family and operator labor from net farm income and dividing the result by the value of farm production. In addition to the operating profit margin, expense ratios are compared across profit margin quartiles. The total expense ratio was computed by summing cash costs, accrual adjustments to costs, and depreciation, and dividing the result by value of farm production. The adjusted total expense ratio was computed by adding unpaid family and operator labor to the expenses included in the total expense ratio and dividing by value of farm production. An adjusted total expense ratio below 1.00 indicates that a farm was able to cover accrual expenses, depreciation, and unpaid family and operator labor. The economic total expense ratio was computed by adding the opportunity cost on net worth to the expenses in the adjusted total expense ratio and dividing by value of farm production. If the economic total expense ratio was below 1.00, the farm or group of farms was covering all accrual and opportunity expenses, and was earning an economic profit.
Profit Margin Quartiles
Before discussing financial performance across profit margin quartiles, we will highlight averages for the sample of farms for the 2008 to 2017 period. Value of farm production averaged $592,485 and net farm income averaged $121,487. The average profit margin was 0.121 or 12.1 percent. The average total expense ratio, adjusted total expense ratio, and economic total expense ratio were 0.795, 0.913, and 1.111, respectively. Approximately 65 percent of the farms had an adjusted expense ratio below 1.0, and approximately 16 percent of the farms covered all accrual and opportunity costs and thus were earning an economic profit.
Figure 1 presents the operating profit margin ratio for each quartile. This figure was created using ten-year average data for each farm. The first quartile represents farms in the bottom quartile while the fourth quartile represents farms in the top quartile. The farms in the top profit margin quartile had an average operating profit margin ratio of 0.234 or 23.4 percent. In contrast, the farms in the bottom profit margin quartile had an average operating profit margin ratio of -0.099.

The farms in the bottom profit margin quartile had relatively high expense ratios (Figure 2). In fact, only 83 percent of the farms in the bottom profit margin quartile had a total expense ratio below 1.0, and none of these farms had an adjusted total expense ratio or economic total expense ratio below 1.0. In contrast, all of the farms in top quartile covered accrual expenses, depreciation, and unpaid family and operator labor (i.e., had an adjusted total expense ratio below 1.0). Moreover, approximately 41 percent of the farms in the top profit quartile earned an economic profit.

Though not emphasized in this paper, we examined the percentage of farms in each size category that were included in each profit margin quartile. The farms in the top profit margin quartile tended to be larger than the farms in the bottom quartile. However, there were farms in each farm size category in the top quartile.
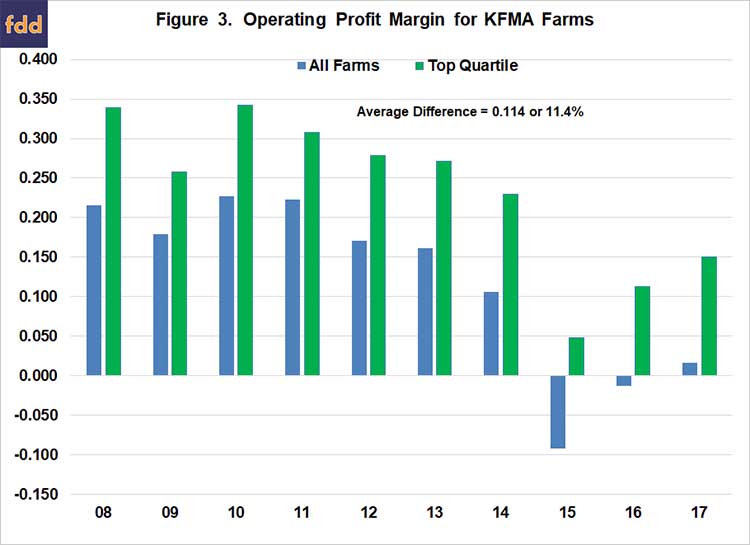
Figure 3 presents the average annual operating profit margin ratio for the entire sample of farms and for farms in the top quartile. The average profit margin for the entire sample was negative in 2015 and 2016 and close to zero in 2017. For farms in the top quartile, the average profit margin ranged from 5 percent in 2015 to 15 percent in 2017 for these same years. Figure 3 also stresses the importance of using multiple years to benchmark farms. For example, a 20 percent profit margin was relatively easy to attain in 2008, 2010, and 2011. For 2015 to 2017, this benchmark would have been very difficult to achieve.

Concluding Comments
In summary, this paper examined the financial performance for a sample of KFMA farms over a ten-year period. Farms in the bottom quartile had a negative operating profit margin ratio indicating that they were not able to fully cover accrual expenses, depreciation, and unpaid family and operator labor. The average operating profit margin ratio for the sample of farms was 12.1 percent. In contrast, the average operating profit margin ratio for farms in the top profit margin quartile was 23.4 percent, or 11.3 percent higher than the average profit margin. Results stress the importance of using several years of data to benchmark financial performance and suggest that it is possible for farms to have a sustained competitive advantage.
Based on the results in this paper, farms are encouraged to use an operating profit margin ratio of at least 20 percent as their benchmark. Expense ratio benchmarks are as follows: total expense ratio below 0.70, adjusted total expense ratio below 0.80, and economic total expense ratio below 1.00.
Disclaimer: We request all readers, electronic media and others follow our citation guidelines when re-posting articles from farmdoc daily. Guidelines are available here. The farmdoc daily website falls under University of Illinois copyright and intellectual property rights. For a detailed statement, please see the University of Illinois Copyright Information and Policies here.


