


A Simple Method of Forecasting Weekly U.S. Corn Planting Progress
The timelines of corn planting is an important yield-influencing factor, so it is no surprise that the pace of corn planting is a topic of perennial interest to the market. The weekly pace of corn planting is often illustrated with a chart similar to the one presented in Figure 1, which shows that 27 percent of corn acreage had been planted in 18 major producing states in the U.S. as of week #17, or April 26, 2020. This was very near the five-year (2014-2018) and contrasts sharply with 2019, where very wet conditions delayed planting substantially (e.g., farmdoc daily, May 1, 2019; June 6, 2019). There is always considerable discussion at this time of year about the current pace of corn planting progress, but somewhat surprisingly, there does not appear be to be nearly as much attention paid to systematic methods of forecasting corn planting progress from week-to-week. The purpose of this article is to present a simple method of forecasting weekly corn planting progress for the U.S.

Analysis
As in our earlier analyses of corn planting progress (farmdoc daily, April 19, 2018; April 17, 2019; April 16, 2020; April 23, 2020), we rely on data reported in the USDA’s weekly Crop Progress report. We collect data on planting progress and the number of suitable field days each week that progress data is reported over 1995 through 2020 for the 18 states included in the weekly Crop Progress report. The 18 states represent an average of 91.9 percent of U.S planted corn acreage over 1995 through 2019. We begin the sample in 1995 because observations on suitable field days starts in the USDA Quick Stats website in 1995. Suitable field days for Texas are only available beginning in 2014, so we have to estimate the missing suitable field days before 2014 for this state. As a proxy, we substitute suitable field days in Oklahoma for the missing days in Texas over 1995-2013. Comparison of Oklahoma and Texas suitable field days for the five years which they overlap reveals a reasonable degree of similarity. Any errors introduced by this procedure are small given the relatively small number of acres planted to corn in Texas.
The first step of the analysis is to analyze patterns in weekly planting progress for corn. Figure 2 presents the percentage planting progress for the U.S. (as measured by the 18 major producing states) from 1995 through 2020. The specific variable analyzed is the amount of planting progress in a particular week, rather than the cumulative pace of planting progress. In other words, the change in total cumulative percentage planted for a given week is presented, as this is the variable of interest to the market. The weekly averages, minimums and maximums are computed across observations for 1995 through 2019. Also, week #14 corresponds roughly with the first week in April and week #22 to the last week in May. We do not present data for weeks outside of this interval because the number of observations is limited.
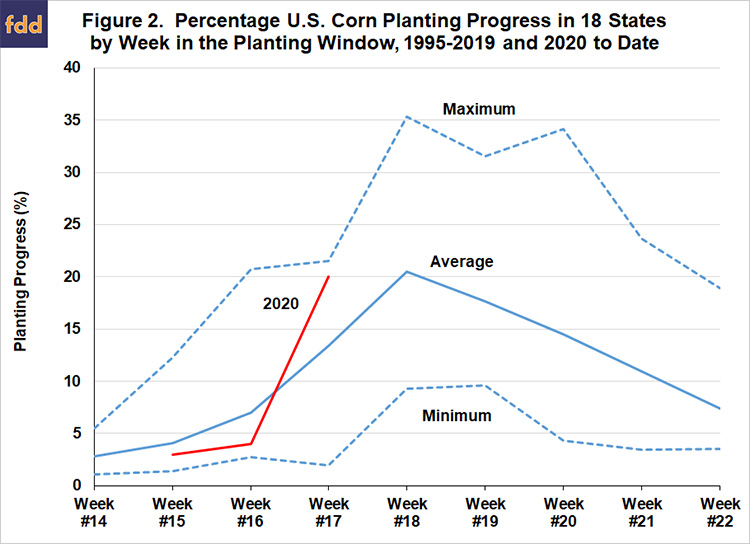
Figure 2 reveals that there is a distinct pattern in weekly corn planting progress. In particular, there is: i) a “ramping up period” in weeks #14-#16 when less than 10 percent of the corn crop is typically planted per week, ii) a “prime period” in weeks #17-#20 when 10 to 20 percent of the corn crop is usually planted per week, and iii) a “mopping up” period in weeks #21-#22 when less than 10 percent is usually planted per week. The three periods correspond roughly to the first three weeks of April, the last two weeks of April and the first two weeks of May, and the last two weeks of May. On average, about two-thirds of the U.S. corn crop is planted in the “prime period.” It is no surprise that that there can be considerable variation from the averages as illustrated by the minimum and maximums in Figure 2. For example, in the peak week #18 the minimum planting progress is 9.3 percent and the maximum is 35.3 percent. Finally, the available data to date for 2020 indicated planting progress behind normal for the first two weeks and then progressing to well-above normal for the third week (20 percent).
The next step of the analysis is to examine patterns in the two components of weekly planting progress—number of suitable field days and percentage progress per suitable field day. We compute a weighted-average suitable number of field days using the planted acreage share for each state each year out of the total acreage for the 18 states. These weights are the same for all weeks within a year. Figure 3 shows the pattern in suitable field days for planting the U.S. corn crop, again as represented by the 18 major producing states. There is an unmistakable upward trend in the average number of suitable field days during the planting window, rising from about 3 days per week in early April to about 4 days per week in late May. This largely reflects the impact of rising temperatures across the planting window as precipitation is generally lower in April compared to May. Given highly variable spring weather conditions it is not surprising that there is a wide range in the number of suitable field days in any given week. Each week to date in 2020 has seen above average suitable field days, with an extremely high number of 4.9 days in the most recent week (#17). Given that planting progress for last week was well-above average (Figure 2), this is an important clue regarding the key role that the number of suitable field days plays in determining overall planting progress per week.
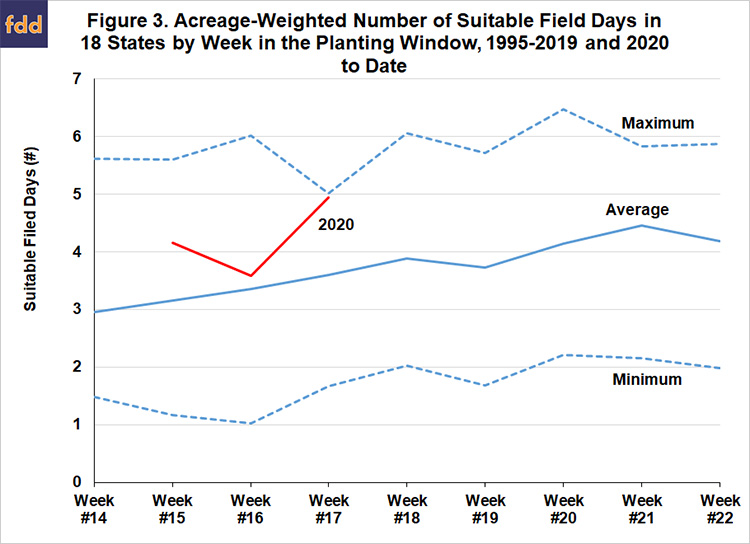
Figure 4 presents the second component of weekly corn planting progress—the percentage progress per suitable field day. This is the truest measure of the weekly speed of planting progress since it normalizes for the number of suitable field days in a week. The patterns shown in Figure 4 are similar to those shown for overall planting progress in Figure 2, and hence, the division into three periods also holds for percentage progress for suitable field day. Not only does total planting progress peak in week #18 but so too does planting progress per suitable field day. This is actually not surprising when one considers that the average number of suitable field days varies relatively little over the planting window compared to average total planting progress. The net impact is similar to dividing average planting progress by a constant, which preserves the original pattern. Figure 4 shows that the rate of corn planting progress per suitable field day is about 1-2 percent in the “ramp up period,” 3-5 percent in the “prime period,” and then 1-2 percent again in the “mop-up period.”
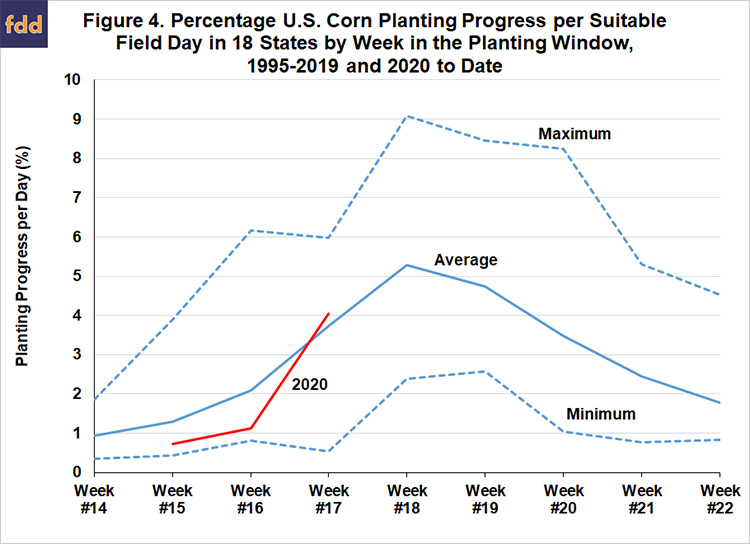
The data in Figure 4 also show that the rate of planting progress per suitable field day in 2020 was somewhat below average the first two weeks of the planting window but very close to average in the most recent week. This helps explain why U.S. corn planting progress at 20 percent last week was historically high (Figure 2). It was not because farmers planted at a much faster rate than usual (Figure 4), but rather, there was an exceptionally large number of suitable field days available for planting corn (Figure 3). This is also the key insight that underlies our simple method of forecasting weekly planting progress for corn.
To introduce our method of forecasting weekly corn planting progress, it is helpful to state the following relationship:
% Planting Progress = (#Suitable Field Days) X (% Planting Progress) / (#Suitable Field Days).
We argue that the first component—# Suitable Field Days—is the both the main determinant of total planting progress and the only forecastable component because it is related to observable weather conditions. We further argue that the second component—% Planting Progress / # Suitable Field Days—cannot be forecast with any precision beyond the historical averages. In simplest terms, our forecasting method uses weather conditions during a week to project suitable field days and then multiply this by the historical average planting progress per suitable field day to project total planting progress for the week.
Some examples will help to illustrate our simple forecasting method. The next weekly Crop Progress report from the USDA will report U.S. corn planting progress for week #18, or May 3, 2020. Lacking any other information, one could use historical averages to forecast planting progress for week #18 in 2020 as follows:
% Planting Progress = (3.88 Suitable Field Days) X (5.28% Planting Progress per Suitable Field Day) = 20.5%.
Alternatively, there is the possibility of having less than normal suitable field days due to rainy conditions during the current week (#18). Let’s assume there are only three suitable field days, then the forecast of planting progress is:
% Planting Progress = (3.00 Suitable Field Days) X (5.28% Planting Progress per Suitable Field Day) = 15.8%.
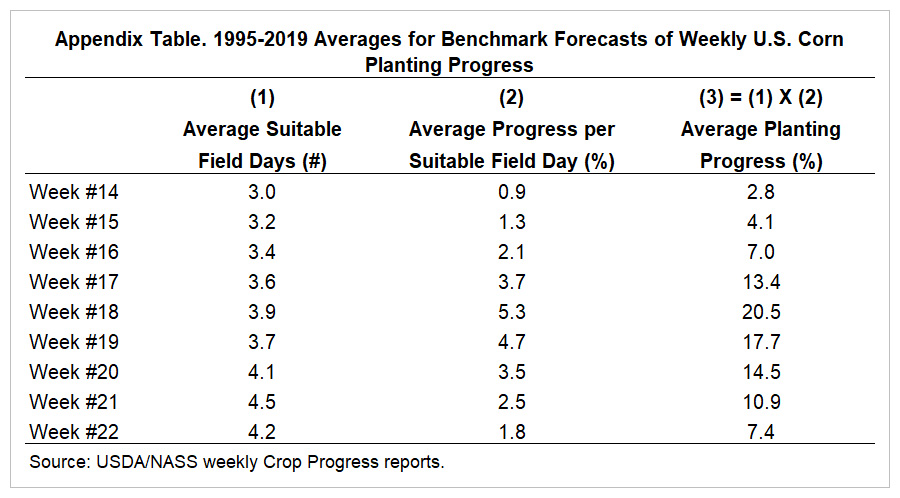
The latter forecast implies (after rounding) that planting progress in week #18 is 16 percent and the total pace of planting increases from 27 to 43 percent for the U.S. The Appendix Table found at the end of this article contains a listing of the 1995-2019 averages by week of the U.S. corn planting window for the number suitable of suitable field days, planting progress per suitable field day, and total planting progress. These can serve as benchmarks when constructing real-time weekly forecasts using the simple method we have proposed in this article.
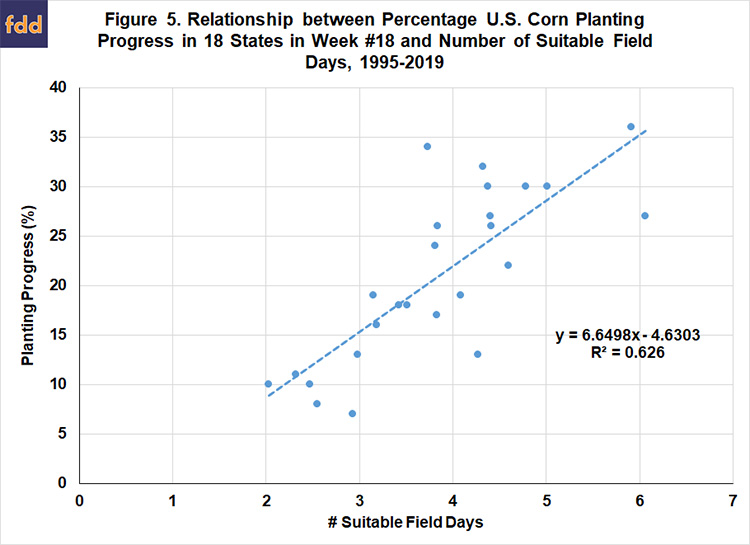
As the final part of the analysis we examine the actual explanatory power of the number of suitable field days for explaining the variation in weekly corn planting progress. For each week between week #14 and #22 over 1995-2019 we regress the number of suitable field days in that week on the percentage planting progress for that week. Not surprisingly, the explanatory power is low in the early and late weeks of the planting window. However, as expected, there is a reasonable degree of explanatory power in the weeks located in the prime of the planting season. Figure 5 presents the regression results for week #18, the peak week of planting progress. The R2 indicates that variation in the number of suitable field days in week #18 explains 63 percent of the variation in percentage planting progress for that week. While this is not a high R2 it does suggest the data during the prime planting window are consistent with the main assumption of our simple forecasting method. Having said that, there can be a considerable amount of error in forecasting both components of weekly corn planting progress and the method should be used with that caution in mind.
Implications
We analyze patterns in weekly U.S. planting progress for corn and develop a simple method of forecasting percentage progress from week-to-week. There is a distinct pattern in weekly corn planting progress that we utilize in this method. In particular, there is: i) a “ramping up period” when less than 10 percent of the corn crop is typically planted per week, ii) a “prime period” when 10 to 20 percent of the corn crop is usually planted per week, and iii) a “mopping up” period when less than 10 percent is usually planted per week. We divide percentage weekly corn planting progress into its two components and argue that the first component—# suitable field days—is the both the main determinant of total planting progress and the only forecastable component because it is related to observable weather conditions. We further argue that the second component—% planting progress per suitable field day—cannot be forecast any better than historical averages. In simplest terms, our forecasting method uses weather conditions during a week to project suitable field days and then multiplies this by the historical average planting progress per suitable field day to project total corn planting progress for the week. While this method is quite simple, it provides a systematic and practical approach to forecasting weekly corn planting progress for the U.S.
References
Irwin, S. and T. Hubbs. "Further Evidence on the Time It Takes to Plant the U.S. Corn Crop." farmdoc daily (10):75, Department of Agricultural and Consumer Economics, University of Illinois at Urbana-Champaign, April 23, 2020.
Irwin, S. and T. Hubbs. "An Update on How Many Days It Takes to Plant the U.S. Corn Crop." farmdoc daily (10):71, Department of Agricultural and Consumer Economics, University of Illinois at Urbana-Champaign, April 16, 2020.
Irwin, S. and T. Hubbs. "Late Planting and Projections of the 2019 U.S. Soybean Yield." farmdoc daily (9):104, Department of Agricultural and Consumer Economics, University of Illinois at Urbana-Champaign, June 6, 2019.
Irwin, S. and T. Hubbs. "Late Planting and Projections of the 2019 U.S. Corn Yield." farmdoc daily (9):79, Department of Agricultural and Consumer Economics, University of Illinois at Urbana-Champaign, May 1, 2019.
Irwin, S. and T. Hubbs. "Here We Go Again: How Many Days Does It Take to Plant the U.S. Corn Crop?" farmdoc daily (9):69, Department of Agricultural and Consumer Economics, University of Illinois at Urbana-Champaign, April 17, 2019.
Irwin, S. and T. Hubbs. "How Many Days Does It Take to Plant the U.S. Corn Crop?" farmdoc daily (8):70, Department of Agricultural and Consumer Economics, University of Illinois at Urbana-Champaign, April 19, 2018.
Appendices
Disclaimer: We request all readers, electronic media and others follow our citation guidelines when re-posting articles from farmdoc daily. Guidelines are available here. The farmdoc daily website falls under University of Illinois copyright and intellectual property rights. For a detailed statement, please see the University of Illinois Copyright Information and Policies here.