


Role of US Farm Interest Expense in Farm Production Expenses
The US Federal Reserve has begun to raise interest rates to dampen inflation. Higher rates imply higher interest expense, assuming no other change. This article explores the role of farm interest expense in the US farm sector. Between 1982 and 2014, farm interest expense declined as a share of farm cash production expenses from 18.3% to 4.4%. Rising interest rates combined with the increase in farm debt since 1991 implies that farm interest expense is expected to increase. A return of interest expense to its historical average 9.5% share of cash production expenses would reduce net farm income by more than 10%, assuming no other change. This article is a companion to the farmdoc daily article of February 18, 2022 that focused on increasing debt on Illinois and US farms.
Role of Farm Interest Expense in Production Expenses: US farm production and interest expense have been compiled by the US Department of Agriculture since 1910. The role of interest expense in cash production expenses, excluding operator dwellings, has varied notably, from a share of 2.8% (1947) to 21.4% (1921). The range is only slightly smaller over the last 50 years: 4.4% (2013 and 2014) to 18.3% (1982). Unsurprisingly, the share has been highest during periods of farm financial stress in the 1920s, 1930s, and 1980s. After an extended and substantial decline between 1982 and 2014, farm interest expense as a share of farm cash production expenses has trended upward.
Interest expense for real estate and nonreal estate debt generally follow one another (see Figure 1). The largest and longest deviation occurred over 1930-1938 when nonreal estate interest expense composed only one third of total interest expense. This low share likely reflected decisions by farms during the Great Depression to minimize cash production expenses in order to preserve cash for other uses, including paying down real estate debt.

Change in Farm Debt and Interest Expense
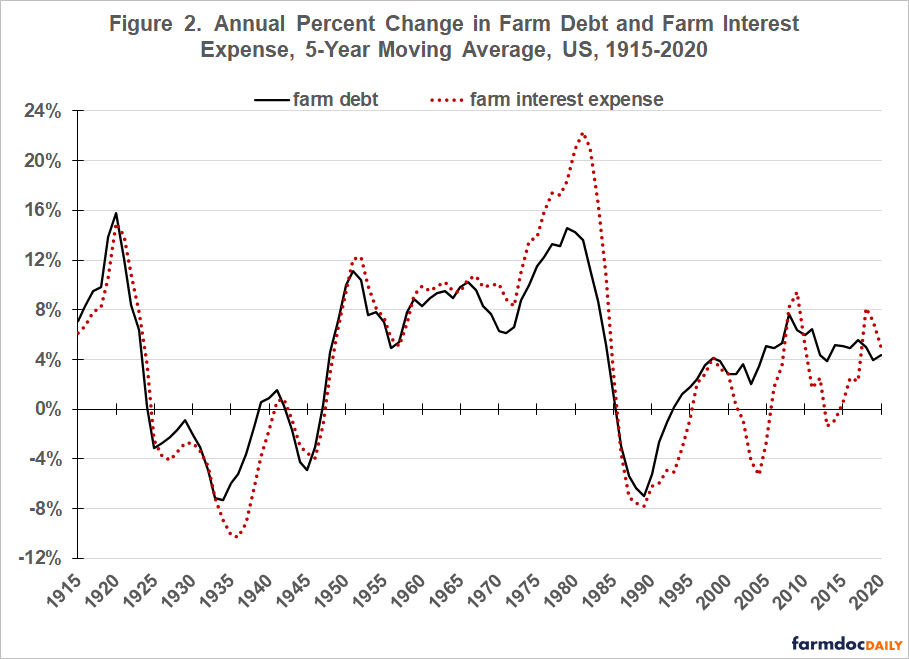
Unsurprisingly, a strong relationship exists between change in farm debt and farm interest expense (see Figure 2). A 5-year moving average is used to smooth annual percent change. Change in farm debt explained 86% of the change in farm interest expense. However 3 periods exist when change in debt and interest expense diverged notably.
- 1935-1939: Farm debt declined faster than interest expense (-7.9% vs. -3.1%) as the US and world began to recover from the Great Depression and associated farm crisis.
- 1970-1984: Interest expense grew faster than debt (+15.1% vs. 10.4%) as interest rates rose in response to rising inflation. This period spanned the farm prosperity of the 1970s and the start of the 1980s farm crisis.
- 1991-2017: Debt grew faster than interest expense (+3.7% vs. +0.7%). The slower growth in interest expense reflected an extended period of declining interest rates (the December 23, 2021 farmdoc daily article discusses US 10-year Treasury bill rates since 1962). Since 1991, US farm debt has cumulatively increased by 235%, going from $131.6 billion to $441.3 billion in 2020.
Summary Observations
Between 1982 and 2014, US farm interest expense declined as a share of US farm cash production expenses from 18.3% to 4.4%. It has been increasing since.
In 2020, US farm interest expense was 5.3% of US cash production expenses, notably below the 9.5% average since 1910.
To gain perspective on what a time path of increasing interest rates might mean for US farm income, an increase in interest expense as a share of cash production expenses from its 2020 value to its 9.5% average historical value would result in a $13.7 billion increase in interest expense ((9.5%-5.3%) * $326.5 billion in 2020 cash production expense). Such an increase implies an 11.7% decline in net cash farm income based on its 2020 value of $117.2 billion (11.7% = $13.7 / $117.2).
In summary, increasing interest rates, when combined with the 235% increase in farm debt since 1991, are likely to put nontrivial pressure on farm income, especially if inflation does not abate. The same concern is noted in the February 18, 2022 farmdoc daily article. Farmers and others in the agricultural supply and production chains need to begin preparing adjustment strategies.
References
US Department of Agriculture, Economic Research Service. March 2022. Farm Income and Wealth Statistics. https://www.ers.usda.gov/data-products/farm-income-and-wealth-statistics/
Zulauf, C., G. Schnitkey, K. Swanson and N. Paulson. "US Interest Rates." farmdoc daily (11):169, Department of Agricultural and Consumer Economics, University of Illinois at Urbana-Champaign, December 23, 2021.
Zwilling, B. "Increasing Agricultural Debt and Impact on Illinois Grain Farms." farmdoc daily (12):23, Department of Agricultural and Consumer Economics, University of Illinois at Urbana-Champaign, February 18, 2022.
Disclaimer: We request all readers, electronic media and others follow our citation guidelines when re-posting articles from farmdoc daily. Guidelines are available here. The farmdoc daily website falls under University of Illinois copyright and intellectual property rights. For a detailed statement, please see the University of Illinois Copyright Information and Policies here.