


A Revised Estimate of Corn Production From the 18 Leading Corn States
Introduction
Five weeks ago, Ibendahl (2022) provided a prediction of national corn yields, acres, and total production. This prediction was based on the USDA weekly crop reports which rates the percentage of the corn crop in each state as either: very poor, poor, fair, good, or excellent. Based on the state crop conditions from 7/24/22 (week 29), Ibendahl estimated a national corn yield of 175.7 bu/ac and a total national production of 14.261 billion bushels. This current paper updates the earlier forecast with the most recent crop condition report – 8/28/22 (week 34).
Update to procedure
Like the July estimate, both the yield and harvested acres are estimated at the state level for the 18 major corn states. These state estimates are then combined to predict national corn production. Corn yields are based on a regression model using an index of crop condition reports from the same week over the last 30 years. Because the model accuracy improves over time, the model for this week (week 34) should be more accurate than the week 29 estimate. Each state is estimated individually so the model is unique to each state and for each week. Corn acres are also estimated at the state level using the percent of corn acres in the very poor category.
Results
Figure 1 is a Likert graph of the corn crop conditions for the last 20 years in the U.S. (The USDA provides a U.S. number in addition to the individual state numbers). The Likert graph is centered on the fair category to make comparisons among years easier. The number along the left-hand-side of the figure is the total of the very poor and poor categories while the number along the right-hand-side is the total of the good and excellent categories.
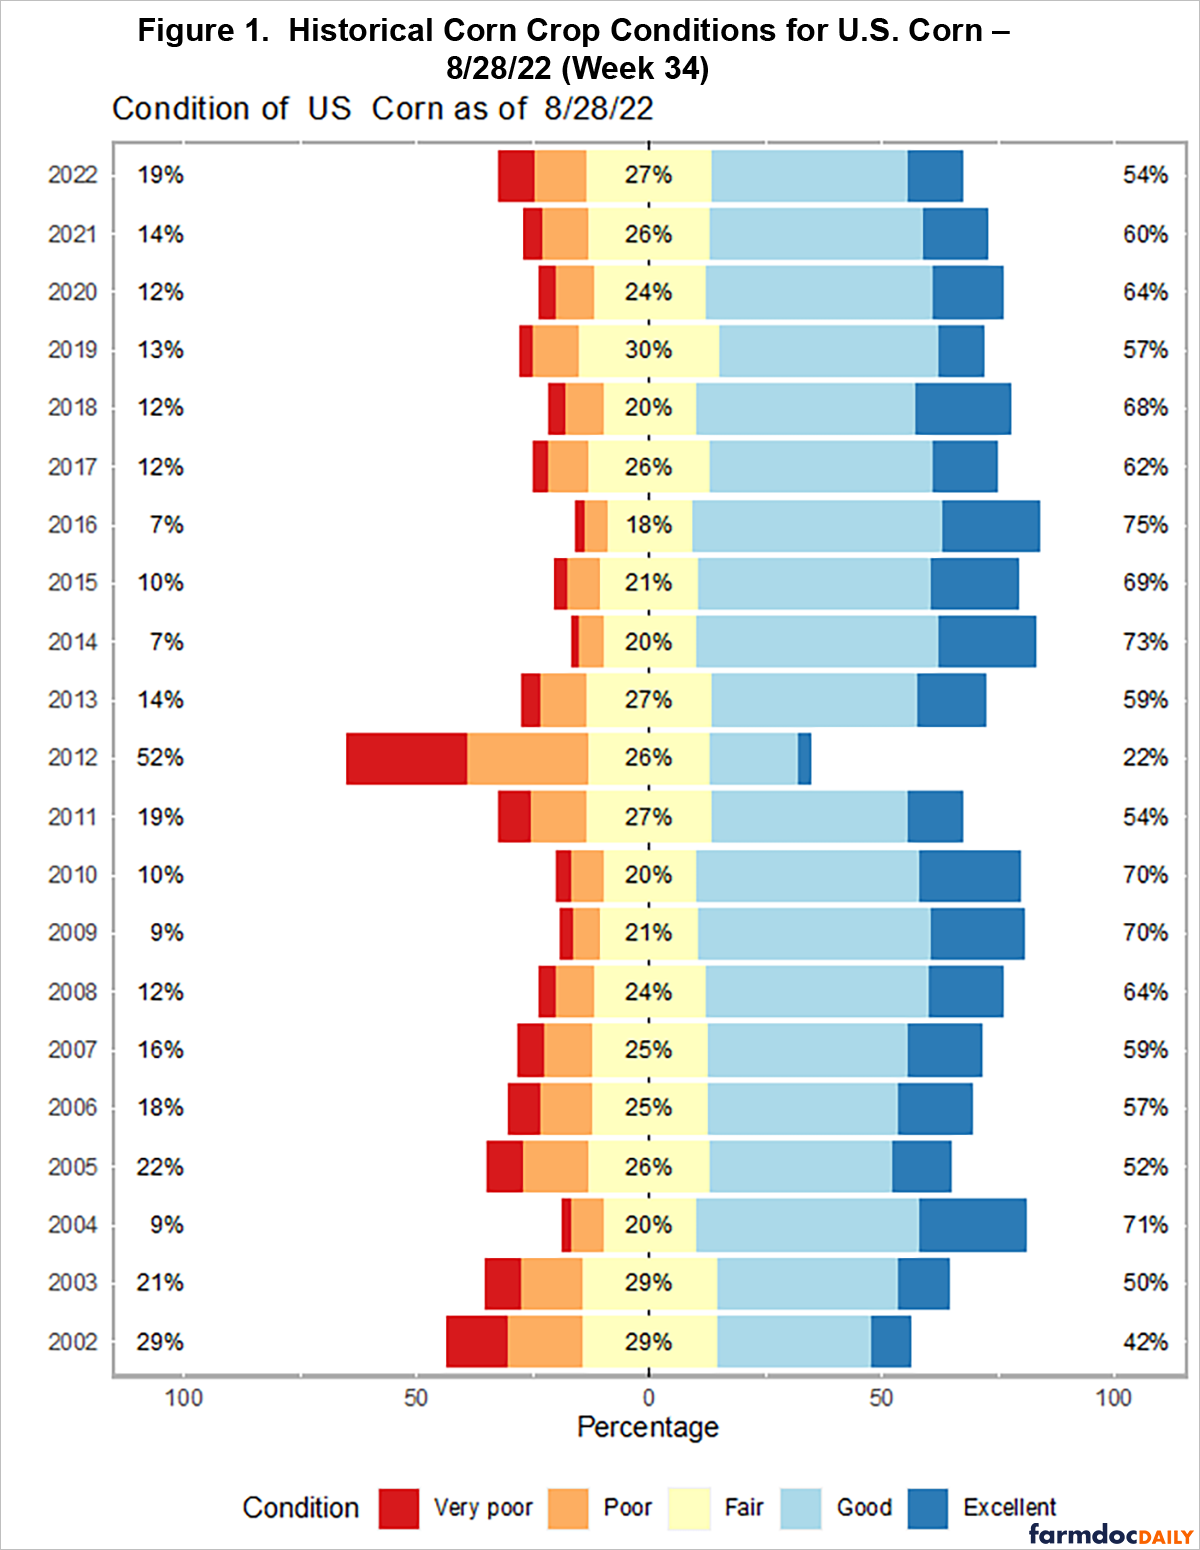
In the last five weeks, the corn crop has gotten slightly worse. In July, 14% of the corn crop was in the very poor and poot categories. Now, that very bottom group has increased to 19%. Likewise, the percentage of corn in the good and excellent categories has decreased from 61% to 54%.
Even though there is a five-week negative change in the crop condition, that seems to be the historical norm. In most of the last 20 years, the percent of corn in the bottom two categories has increased during the month of August. While 2022 doesn’t stick out like 2012, it still is a below normal year for crop conditions. In the last 20 years, only 5 years have had a higher percentage of the corn crop in the very poor and poor categories.
Table 1 shows the estimated yield per harvested acre prediction along with the confidence intervals for each state as of 8/28/22 (week 34.). Because the crop is closer to harvest, the model accuracy has improved. Despite the national corn crop looking worse, the yield outlook has improved in several states from five weeks ago. However, the biggest corn state, Iowa, has seen their predicted yield decline by 4 bu/ac from five weeks ago.
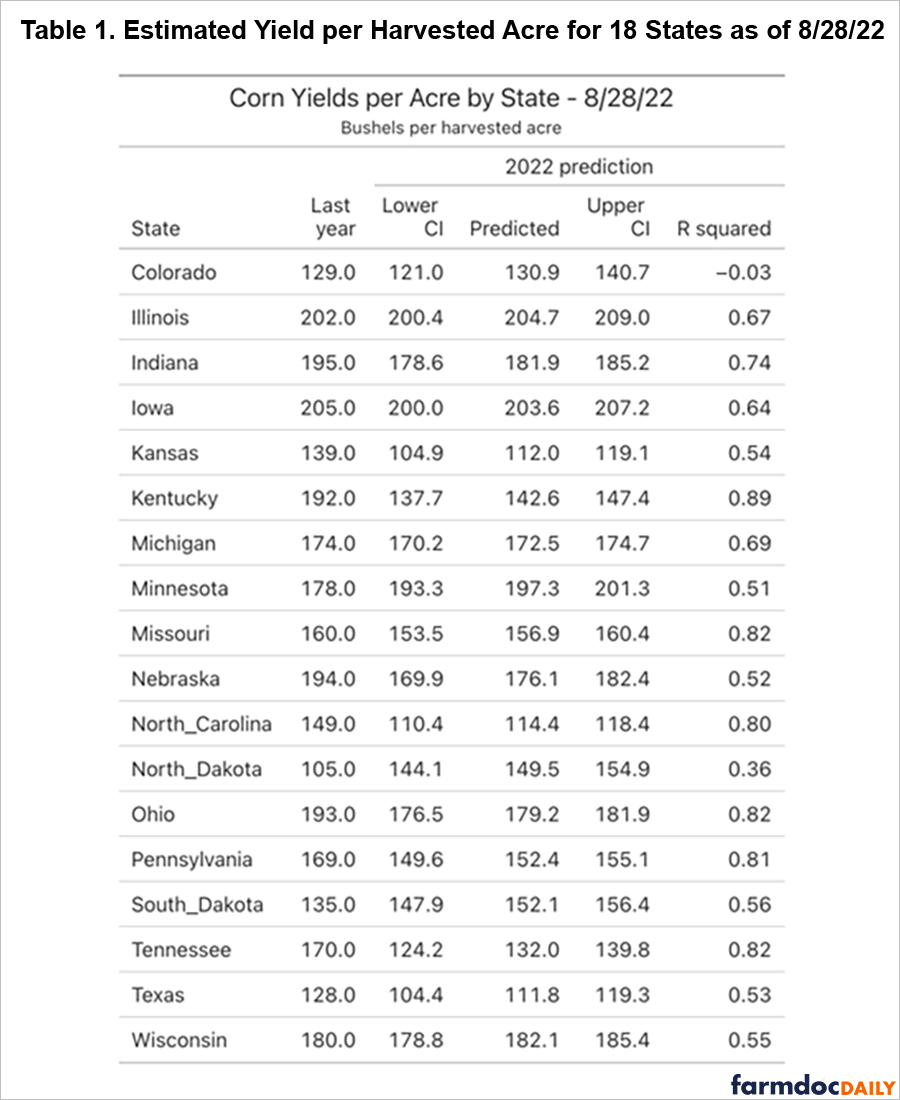
Table 2 shows the estimated harvest acres for each state using the percent of corn in the very poor category as of week 34. The USDA, in their August crop production report, predicted corn acres at the same level as their June report except for a small decline in Minnesota. The model used here mostly reflects that except for a larger decline in Kansas, Colorado, and Nebraska.

The predicted harvested acres for the 18 major corn states is estimated to be 74.962 million acres. This is a decline of 0.9% from five weeks ago and a decline of 5.8% from last year.
Table 3 shows the estimated corn production by state and is produced by multiplying Table 1 and Table 2 together. The current estimate is for 13.161 billion corn bushels from the 18 biggest corn states with a range of 12.562 billion to 13.777 billion corn bushels. Corn production of 13.161 billion bushels from these 18 states would represent a 6.7% decline in corn production from last year. However, this August estimate is only 1.1% below the July estimate.
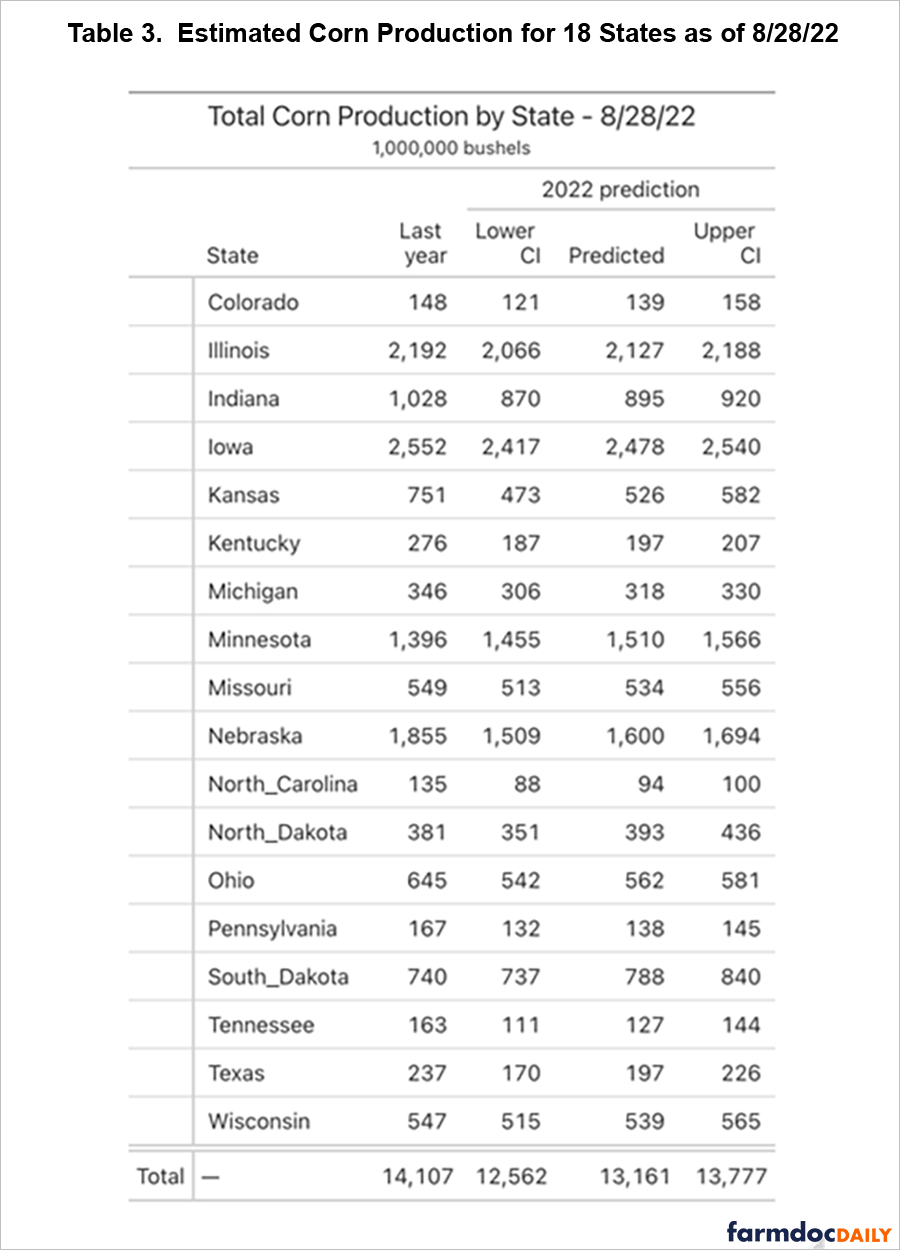
Table 4 projects the 18 leading corn states acres and production into a national total for acres and production. To get the national totals, the acres and corn production from the 18 major corn states are compared to the harvested acres and production from those same 18 states last year. These percentage changes are then used to adjust the national harvested acres and production from last year. These national projections thus assume that the same changes in the 18 major corn states apply to the other corn states.
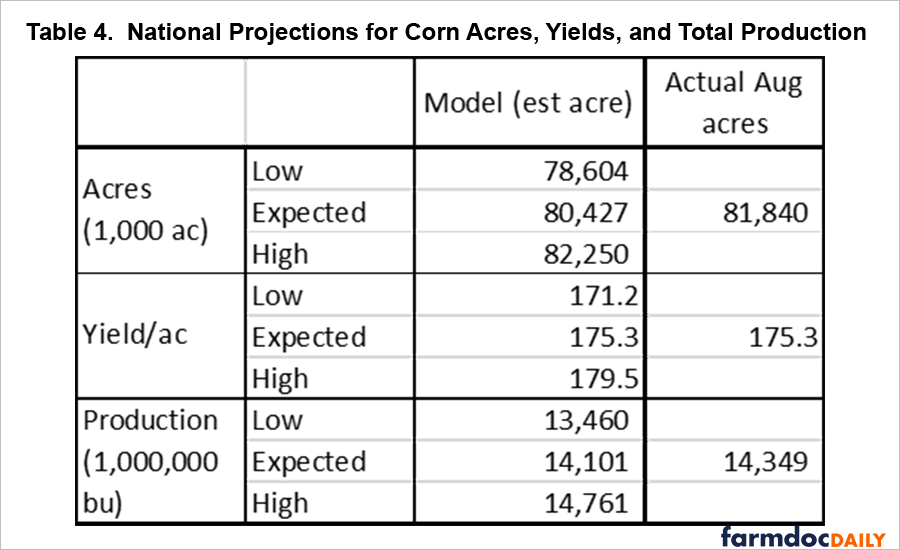
Because the yield per acre from the individual states can’t be summed together, the shown yield per acre is calculated from the total production divided by the total harvested acres. As the table indicates, total production is expected to be 14.101 billion bushels with a range from 13.460 to 14.761 billion bushels. Harvest acres are expected to be 80.427 million acres with a range from 78.604 to 82.250 million acres. These numbers are all calculated using estimated harvested acres as a function of the June acres. The last column in Table 4 has the actual August corn acre numbers from the USDA. This number (81.840 million acres) assumes harvested acres equal the August estimated acres.
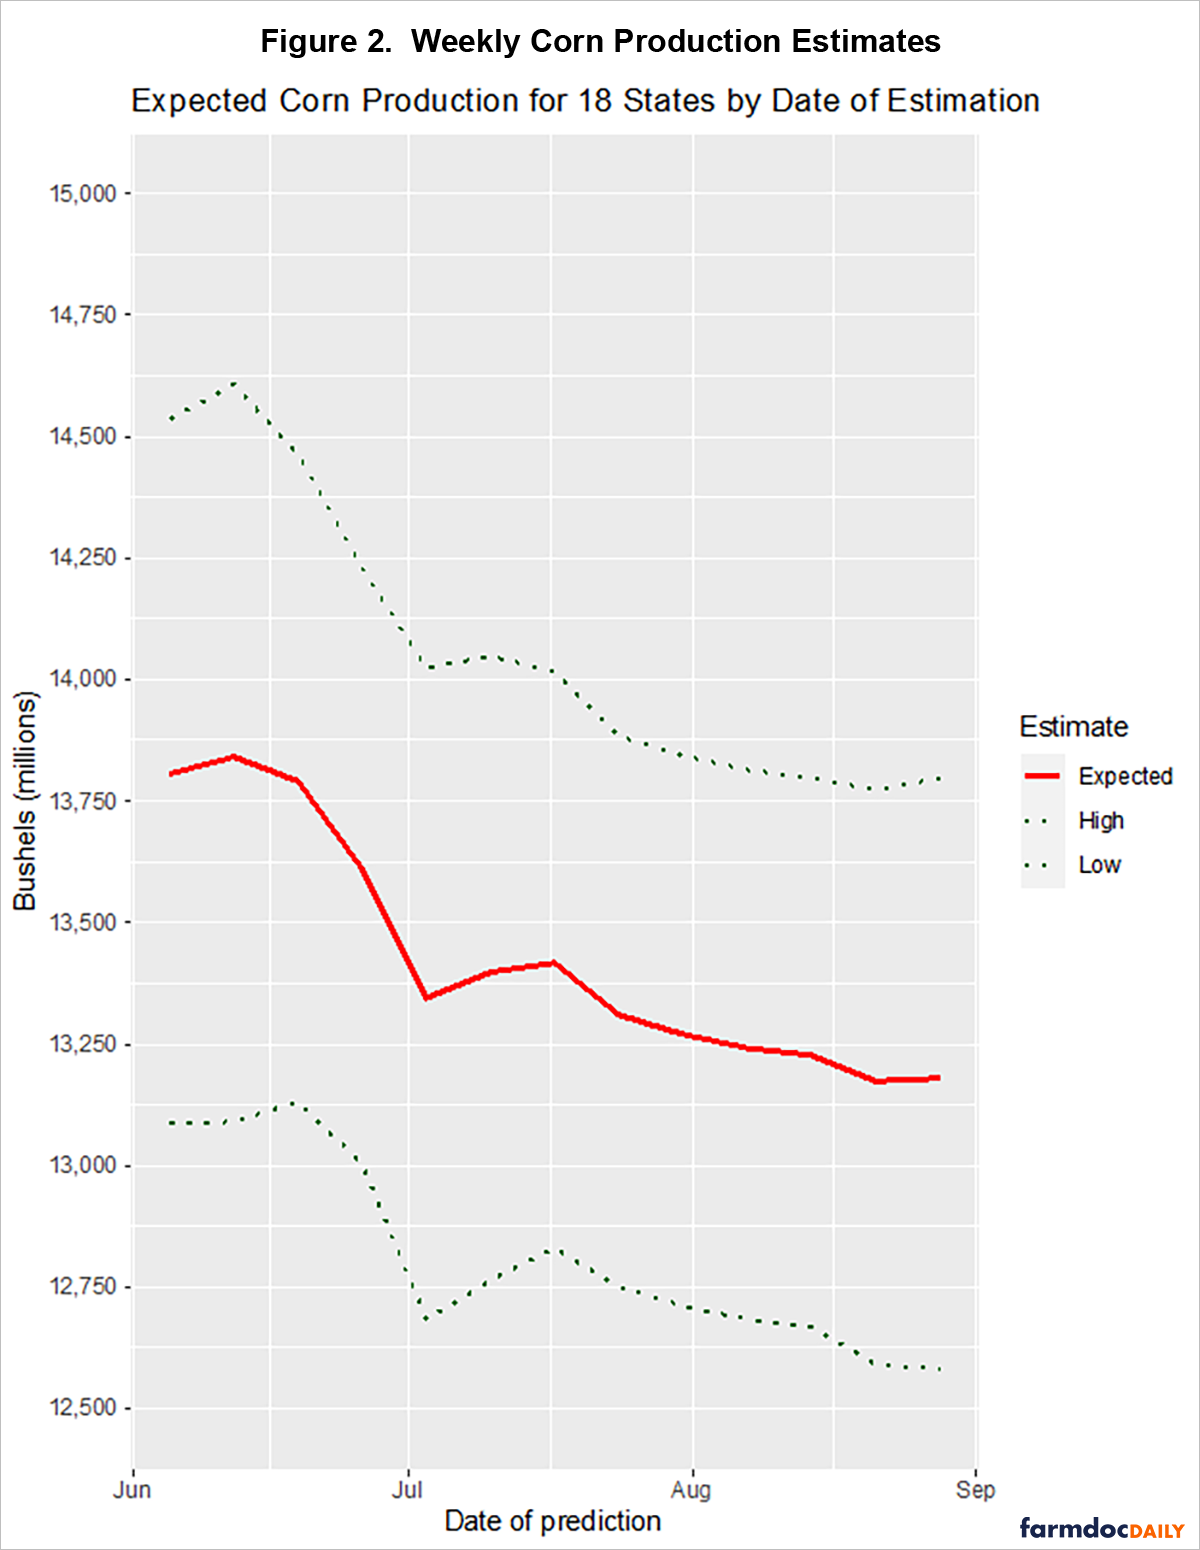
Figure 2 shows how the model prediction has changed during the growing season. Estimates have been trending downward most of the year reflecting the worsening crop conditions in the U.S.
Other points
The USDA in their August 12 Crop Production report predicted an average yield of 175.4 bu/ac. The model developed here predicts an average yield of 175.3 bu/ac. It probably shouldn’t be surprising that the USDA estimate is so close to this paper’s estimate given the model is based on USDA crop reports. What might be a little surprising is that the predicted yield has not dropped very much during the last half of August.
References
Ibendahl, G. "An Estimate of Corn Production From the 18 Leading Corn States." farmdoc daily (12):111, Department of Agricultural and Consumer Economics, University of Illinois at Urbana-Champaign, July 27, 2022.
USDA, National Agricultural Statistics Service. Crop Production (August 2022). https://downloads.usda.library.cornell.edu/usda-esmis/files/tm70mv177/n5840309g/2n49v849f/crop0822.pdf
Disclaimer: We request all readers, electronic media and others follow our citation guidelines when re-posting articles from farmdoc daily. Guidelines are available here. The farmdoc daily website falls under University of Illinois copyright and intellectual property rights. For a detailed statement, please see the University of Illinois Copyright Information and Policies here.