


A View of the 2023 Farm Bill at the Starting Line in the House
In the United States House of Representatives, organizing resolutions were agreed to in recent weeks to elect chairs, ranking members, majority and minority members of the standing committees (H. Res. 80 (Majority); H. Res. 79 (Minority); H. Res. 14 (Chairs); H. Res. 15 (Ranking Members)). The starting line for a potential 2023 Farm Bill in the House is the Committee on Agriculture. To provide some perspective on the reauthorization debate, this article reviews publicly available information about the districts represented by members of the House Agriculture Committee.
Background
As discussed previously, if Congress reauthorizes the omnibus suite of programs and policies in a farm bill this year, that path begins at the committee level (farmdoc daily, February 9, 2023). Committees are the workhorses of Congress; they hold the hearings, investigate, provide oversight, and either review bills introduced or initiate the drafting (see e.g., Now & Then, February 15, 2023). For complex, omnibus legislation like a farm bill, the committees often take the lead on negotiating and writing early drafts, as well as consolidating various bills introduced by other Members. A committee print of legislation will be brought before the committee or subcommittees in a process known as a markup where members consider and debate the bill, as well as offer and debate amendments to revise it. If the committee agrees on legislative text, it will vote to report it to the full chamber for consideration, debate and possible further amendment or revision. The chair and ranking member of the committee manage the bill on the floor. If a conference committee is convened to work out the differences between House and Senate versions, the four committee leads (chair and ranking from House and Senate, commonly referred to as the “four corners”), along with other committee members appointed by leadership, will resolve differences and produce a final legislative text. This conference bill is reported back to the House and Senate for final consideration and, if passed, is presented to the President for signature or veto.
Discussion
The 118th Congress is narrowly divided between the party caucuses in both chambers. The House is controlled by Republicans (222 to 213) with 218 votes needed and the Committee on Agriculture features a three-vote majority for Republicans (28 Republicans to 25 Democrats) (House Agriculture Committee, Committee Members). Much about a farm bill comes down to the politics between federal payments to farmers and federal payments to low-income persons and households for the purchase of food in the Supplemental Nutrition Assistance Program (SNAP). While the politics of farm bill involve a far greater number of programs, policies, priorities, and interests, farm assistance and food assistance are usually critical to the effort; the search for common ground between them determines much about farm bill, as well as any successful navigation of the complex, complicated and difficult legislative process (see e.g., farmdoc daily, January 12, 2023). A comparison between payments to farmers and SNAP assistance will be used to provide initial perspective on the House Agriculture Committee and a potential 2023 farm bill debate.
(1) Overview of the Districts Represented on House Agriculture
Figure 1 begins the review by mapping the districts represented on the House Agriculture Committee using red for Republicans (Majority) and blue for Democrats (Minority). The districts of Chairman Glenn (GT) Thompson (PA-15) and Ranking Member David Scott (GA-13) have striped patterns. Note that Representative Stacey Plaskett (D-VI) is a member of the committee from the U.S. Virgin Islands but is not included on the map.

The map illustrates some of the geographical differences between the Majority and Minority on the House Agriculture Committee. Table 1 adds further context using data from the Census Bureau (U.S. Census Bureau, My Congressional District), the 2017 Census of Agriculture (USDA, 2017 Census of Agriculture: 2017 Congressional District Profiles), and USDA’s Food and Nutrition Service, for fiscal year (FY) 2018 (USDA, FNS: SNAP Community Characteristics). Given relatively proportional representation, the total population represented by each caucus on the Ag Committee is close: the 28 Republicans represent a total of 21.4 million people, while the 25 Democrats represent just over 18 million people.

Both Republicans and Democrats represent relatively similar numbers of households receiving SNAP benefits in FY2018: 909,260 for Republicans and 882,771 for Democrats. Note that the FY2018 data does not entirely match with the 118th Congress districts given redistricting and the totals in Table 1 include a few districts that have changed in either size or area covered within the State. The data in Table 1 includes district information that best aligns between FY2018 and the 118th Congressional districts, but not an exact match in all districts.
Likely most notable in Table 1 is the difference between the parties in terms of farm representation. Republicans represent an estimated 289,315 more farms than Democrats and nearly 158 million more acres in farms, according to the 2017 Census of Agriculture. Again, the districts for the 2017 Census of Agriculture do not align completely with all districts in the 118th Congress and district information is used that best matches current districts (although is not exact). It is also important to note that number of farms is not the same as total farmers or total farm operators. It is a rough approximation of the farming presence in each district, totaled for Republicans and Democrats on the committee.
Because of the size of the House Agriculture Committee (53 Members), some of the review that follows will categorize the districts using USDA Economic Research Service Farm Resource Regions (USDA, ERS Far Resource Regions September 2000). Figure 2 graphs the number of Representatives on the House Agriculture Committee by ERS Farm Resource Region and political party (red, Republicans; blue, Democrats).

(2) Overview of Farms in the Districts Represented on the House Agriculture Committee
Based on the 2017 Census of Agriculture, Republican districts represent 83% of the farms and 84% of the land in farms on the committee but received 91% of the total government farm payments. Table 2 summarizes the additional farm data.

Figure 3 charts a comparison of the distribution of farm payments (solid red or blue) by Farm Resource Region and party with the distribution of land (patterned red or blue) as percentages of the total for each. The four districts represented by Republicans in the Prairie Gateway region, for example, contain 35.6% of the total land in farms while receiving 26.8% of the total farm payments. Where the solid bar is taller than the patterned bar, the region receives a larger share of federal payments than its share of total land in farms.

Where both parties have districts in the region, Republican districts contain more acres and receive more payments than districts represented by Democrats. The only exceptions are in the Basin & Range and the Fruitful Rim regions. In the former, Democratic districts contain a larger share of acres (8.7%) than Republican districts (1.6%) and receive a slightly larger share of total payments (0.9% to 0.6%); in the latter, they are nearly equal with slightly more acres (2.1% to 1.7%) in Democratic districts but receiving a slightly smaller share of total payments (0.81% to 0.84%).
(3) Overview of SNAP for Districts Represented on the House Agriculture Committee
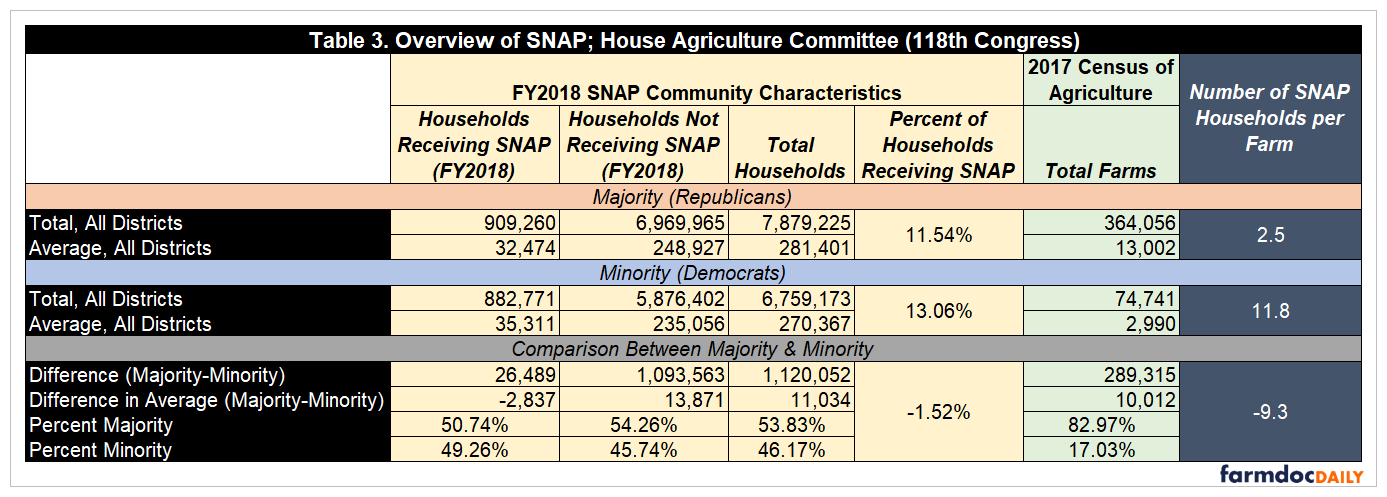
Table 3 compares SNAP households for districts represented by Republicans to those represented by Democrats. With three districts more than Democrats, Republicans represent slightly more households receiving SNAP (50.7% to 49.3%), but a larger share of the households not receiving SNAP and total households. When the number of SNAP households is compared to the number of farms, of which Republican districts represent substantially more, the difference is 2.5 households receiving SNAP to every farm in Republican districts and 11.8 households receiving SNAP to every farm in Democratic districts.
Using the ratio comparison, Figure 4 charts the number of SNAP households per farm for each of the Farm Resource Regions and by party. In each region, the districts represented by Democrats have higher ratios of households receiving SNAP to farms as compared to districts represented by Republicans and for some regions the differences are substantial.

Concluding Thoughts
To the extent that the simple comparisons in this article indicate the respective priorities of the majority and minority, the view from the starting line in the Committee on Agriculture of the U.S. House of Representatives is one of stark differences between Republicans and Democrats. While both represent nearly equal numbers of households receiving SNAP, districts represented by Republicans have far more farmers, land in farms and receive a larger share of total farm payments. Among other things, one result is that Democratic districts represent a much larger ratio of SNAP households to farms. If a Congress narrowly divided between the parties is to achieve farm bill reauthorization in 2023, it will likely require—at the very least—maintaining a bipartisan coalition and that coalition likely depends on how these two priority areas are addressed.
References
Coppess, J. "A View of the 2023 Farm Bill at the Starting Line in the Senate." farmdoc daily (13):23, Department of Agricultural and Consumer Economics, University of Illinois at Urbana-Champaign, February 9, 2023.
Coppess, J. "Considering Congress, Part 4: The Double Majority." farmdoc daily (13):6, Department of Agricultural and Consumer Economics, University of Illinois at Urbana-Champaign, January 12, 2023.
Disclaimer: We request all readers, electronic media and others follow our citation guidelines when re-posting articles from farmdoc daily. Guidelines are available here. The farmdoc daily website falls under University of Illinois copyright and intellectual property rights. For a detailed statement, please see the University of Illinois Copyright Information and Policies here.