


A View of the 2023 Farm Bill at the Starting Line in the Senate
One of the first orders of business in a new Congress is the organization of the standing committees, including the assignment of committee members. In the United States Senate, the organizing resolutions were agreed to on February 2, 2023 (S. Res. 30 (Majority); S. Res. 31 (Minority)). The starting line for a potential 2023 Farm Bill in the Senate is the Committee on Agriculture, Nutrition, and Forestry. To provide some perspective on the reauthorization debate in the Senate, this article reviews some publicly available information about the States represented by Senators on the committee.
Background
If Congress reauthorizes the omnibus suite of programs and policies in a farm bill this year, that path begins at the committee level. By way of brief overview (or review) of the process: committees are the workhorses of Congress; they hold the hearings, investigate, provide oversight, and either review bills introduced or initiate the drafting. For complex, omnibus legislation like a farm bill, the committees often take the lead on negotiating and writing early drafts, as well as consolidating various bills introduced by committee members. A committee print of legislation will be brought before the committee or subcommittees in a process known as a markup where members consider and debate the bill, as well as offer and debate amendments to revise it. If the committee agrees on legislative text, it will vote to report it to the full chamber for consideration, debate and possible further amendment or revision. The chair and ranking member of the committee manage the bill on the floor. If a conference committee is convened to work out the differences between House and Senate versions, the four committee leads (chair and ranking from House and Senate, commonly referred to as the “four corners”), along with other committee members appointed by leadership, will resolve differences and produce a final legislative text. This conference bill is reported back to the House and Senate for final consideration and, if passed, is presented to the President for signature or veto.
Discussion
The 118th Congress is divided along partisan lines and between the chambers, but with very narrow majorities. The Senate is controlled by Democrats (51 to 49) with a bare majority needed for passage, but due to Senate rules, legislation generally needs 60 votes to proceed over any objections through a process known as invoking cloture. The House is controlled by Republicans (222 to 213) with 218 votes needed. Membership on the committees is generally determined by leadership based on Senators’ requests and priorities; the majority-minority split on the committee is generally based on the balance between the caucuses in the chamber. In the Senate, the Committee on Agriculture, Nutrition, and Forestry (Senate ANF) features a one-vote majority for Democrats (12 Democrats to 11 Republicans) (Senate.gov, Committee Membership List). Much about a farm bill comes down to the politics between federal payments to farmers and federal payments to low-income persons and households for the purchase of food in the Supplemental Nutrition Assistance Program (SNAP). While the politics of farm bill involve a far greater number of programs, policies, and interests, farm assistance and food assistance usually drive the effort and the search for common ground between them determines much about farm bill, as well as its successful navigation of the complex, complicated and difficult legislative process (see e.g., farmdoc daily, January 12, 2023).
(1) Overview of the States Represented on Senate ANF
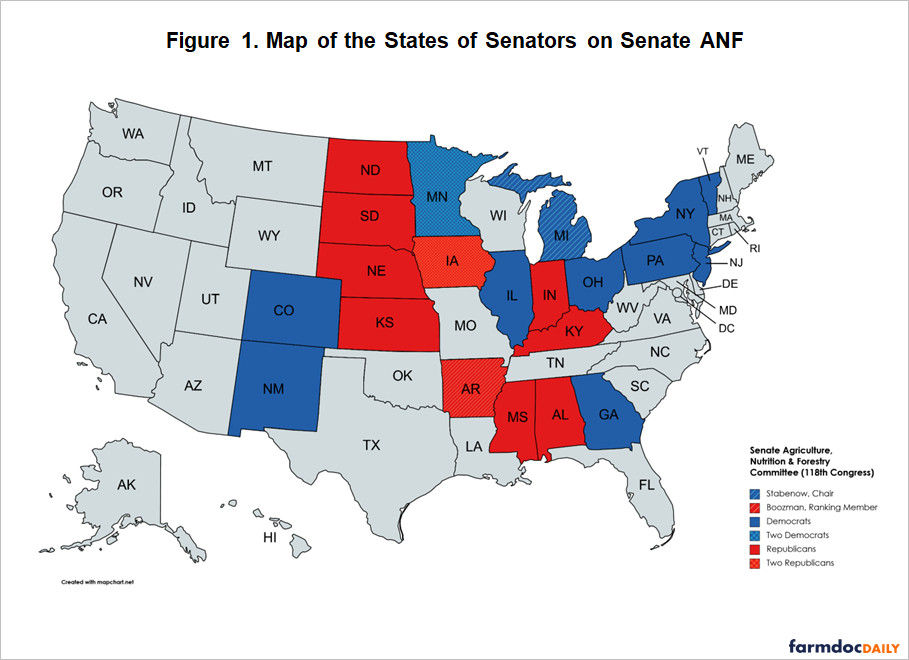
Figure 1 is a map of the States represented by Senators on the Agriculture, Nutrition, and Forestry (ANF) committee, where blue are Democrats who are in the majority and red are Republicans, in the minority. Senator Debbie Stabenow (MI) is the chair and Senator John Boozman (AR) is the Ranking Member (stripes). Also note that both Senators from Minnesota and Iowa are on the committee (checkered).
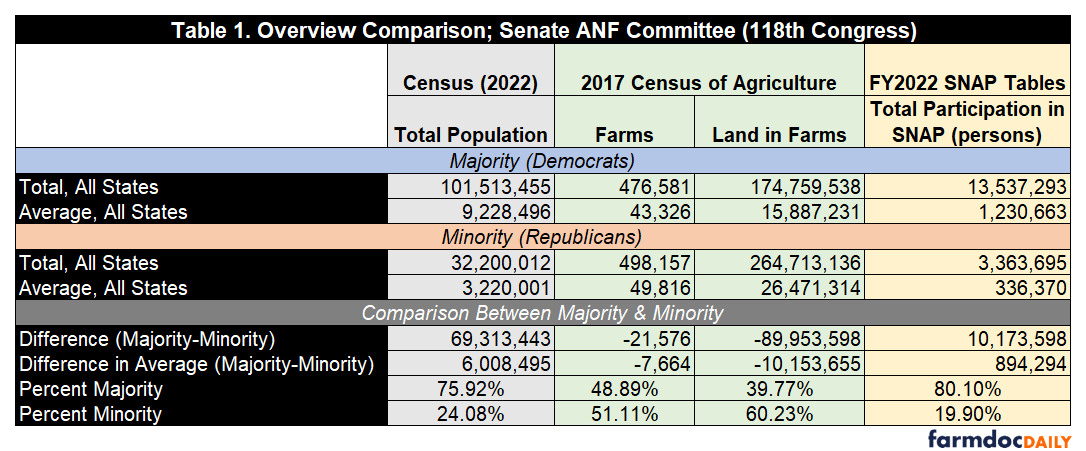
Comparing the Majority (Democrats) and Minority (Republicans) sides of Senate ANF continues from the map to the differences in population in the States that the Senators represent. For example, Democrats represent over 101 million people while Republicans represent just over 32 million. Republicans represent over 21,000 more farms and their states have nearly 90 million more acres of land in farms. Democrats represent over 10 million more persons participating in SNAP. An important note, the use of total farms in this discussion is an approximation for the number of farmers; total farms does not equal total farmers or total farm operators. Table 1 summarizes the population from the Census (U.S. Census Bureau, State Population Totals and Components of Change: 2020-2022), the total farms and land in farms the 2017 Census of Agriculture (USDA, 2017 Census of Agriculture, By State), and total persons participating in SNAP for fiscal year (FY) 2022 as reported by USDA’s Food and Nutrition Service (USDA, FNS, SNAP Tables).
In total, Republicans represent over 21,000 more farms than Democrats, with total farms used as an approximation of the farm population but does not equate total number of farmers or farm operators. Figure 2 compares the states by the total farms as a percent of total population. In only three Democratic states are the total farms more than 1% of total population: Minnesota (1.2%), New Mexico (1.2%) and Vermont (1.05%). For Republicans, however, in only two states are the total farms less than 1% of the total population: Alabama (0.8%) and Indiana (0.83%). By this measure, North Dakota has the highest percent of total farms to total population (3.4%) and New Jersey has the lowest (0.11%).

(2) Overview of Farms in the States Represented on Senate ANF
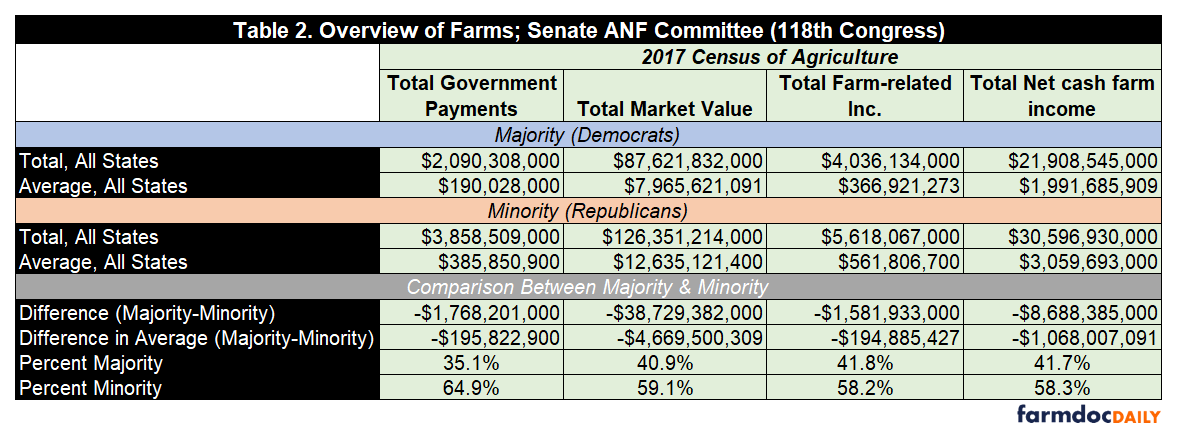
Because they represent more farmers and their States have more land in farms, it stands to reason that Republican states receive more in government payments and have higher amounts in the market value of products sold, total farm-related income and total net cash farm income. Table 2 summarizes this additional information from the 2017 Census of Agriculture. What is most notable is the degree to which Republican states receive more in farm payments. While total market value, farm-related income and total net cash income are split about the same (42% for Democratic States and 58% for Republican States), the share of farm payments is much higher for Republican States (35% to 65%) in total.
Looking closer at payments to farmers, Figure 3 graphs total farm payments as a percent of total market value of products sold from the 2017 Census of Agriculture by State. This is also an approximation of payments because not all agricultural products sold are program crops or receive payments. On average, for States represented by Democrats payments are 2% of total market value and for those represented by Republicans payments average over 3% of total market value.

(3) Overview of SNAP in the States Represented on Senate ANF
Given the significant differences in population represented by Democrats and Republicans on Senate ANF, it is not surprising that there are substantial differences with respect to the SNAP program. Table 3 summarizes the SNAP data from USDA’s Food and Nutrition Service for fiscal year (FY) 2022 (USDA, FNS SNAP Tables). Democrats, representing 76% of the total population for the States, also represent 80% of the SNAP participants. Also notable in the summary data, SNAP participation in Democratic states is higher than in Republican states (13% to 10% respectively). Finally, the larger number of SNAP participants in Democratic states coupled with the lower number of farmers produces a much higher ratio in those states: roughly 28 SNAP participants to each farm for Democratic Senators compared to just under 7 SNAP participants to each farm for Republicans.

Comparing across the States, Figure 4 charts each State’s SNAP participation as a percentage of its total population. Most of the Republican States on the committee have less than 10% of their population participating in SNAP in FY2022, except Kentucky (12%), Mississippi (14%), and Alabama (15%). By comparison, most of the Democratic states have more than 10% of their total population participating in SNAP; Minnesota (7%), Colorado (7.7%) and NJ (8.2%) are the exceptions.
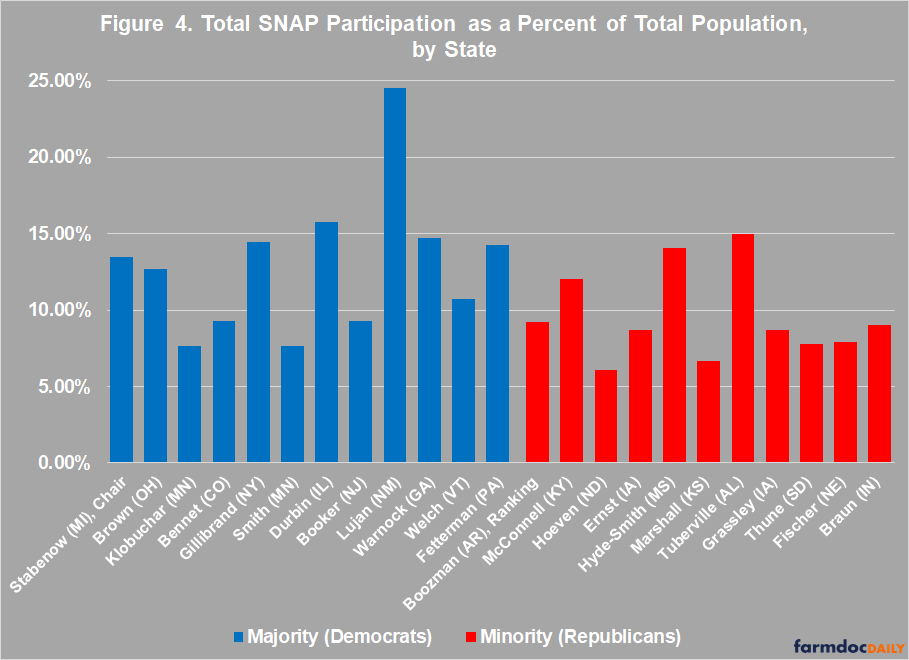
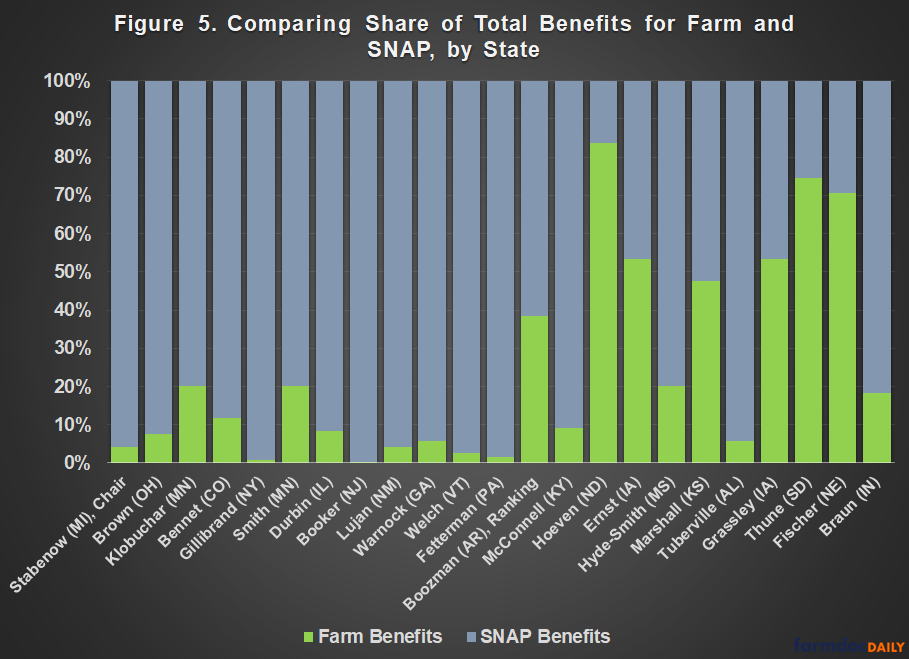
Figure 5 provides the final perspective, comparing the share of the total benefits (SNAP plus farm) for SNAP and farm payments for each state. This provides a rough approximation of each State’s split between SNAP and farm payments. In general, Democratic States receive the vast majority in SNAP while Republican States tend to have higher shares in farm payments. North Dakota (83.8% in farm payments), South Dakota (74.6% in farm payments), and Nebraska 70.7%) stand out as the only states where farm payments make up a vast majority of the benefits; Iowa (53.4%) is also notable for getting more in farm payments than SNAP. On average, states represented by Democrats receive 92% of the total benefits from SNAP while states represented by Republicans average nearly 57%.
Concluding Thoughts
At the starting line in the Senate for a possible 2023 Farm Bill, an overview of the Agriculture, Nutrition, and Forestry Committee presents important differences between the states represented by Democrats on the committee and those represented by Republicans. The states represented by Democrats generally have larger total populations and total SNAP participants, whereas the states represented by Republicans generally have more farms, land in farming and significantly larger federal payments to farmers. While all Senators represent farmers and states that receive farm program benefits, as well as SNAP participants and benefits, the differences break along party lines. This overview highlights the potential challenges for the committee to negotiate a bill because it helps provide context on the competing priorities of committee members, their states and constituencies. It also serves a reminder of the strength of the coalition in a farm bill, bridging across the partisan divide through both farm and food assistance.
References
Coppess, J. "Considering Congress, Part 4: The Double Majority." farmdoc daily (13):6, Department of Agricultural and Consumer Economics, University of Illinois at Urbana-Champaign, January 12, 2023.
Disclaimer: We request all readers, electronic media and others follow our citation guidelines when re-posting articles from farmdoc daily. Guidelines are available here. The farmdoc daily website falls under University of Illinois copyright and intellectual property rights. For a detailed statement, please see the University of Illinois Copyright Information and Policies here.