A View of the 2023 Farm Bill from the CBO Baseline
On February 15, 2023, the Congressional Budget Office (CBO) released its analysis and projections for the federal debt of the United States and the statutory debt limit (February 15, 2023). As part of that release, CBO also provided the all-important ten-year baseline for the mandatory programs in the Farm Bill (CBO, Details About Baseline Projects for Selected Programs). Release of the CBO Baseline is a critical step in the farm bill reauthorization process. This article provides an initial review of the CBO Baseline projects for those programs relevant to the farm bill reauthorization debate.
Background
Much of the modern Congressional development of federal budget discipline policy and law began with the Congressional Budget and Impoundment Control Act of 1974 which, among other things, created the Congressional Budget Office (CBO) (farmdoc daily, November 29, 2018). One development in federal budget law was the requirement that CBO annually produce baseline estimates (2 U.S.C. §907). In short, CBO projects the baseline using as its primary assumption that enacted statutes continue without change through the baseline years. Thus, mandatory farm bill programs, even if scheduled to expire, are assumed to continue, and spending projections are built around assumptions as to key program criteria (i.e., for farm programs prices, yields, etc. for the program crops). This provides valuable information about program performance and basic economic forecasts. Arguably the more challenging aspects of budgetary laws are the enforcement mechanisms, such as statutory pay-as-you-go (PAYGO) policies (2 U.S.C. §§931-939). In general, enforcement mechanisms tend to emphasize a version of budget neutrality which often requires committees to adhere to (or remain within) their spending baselines. In practical terms this means that any legislation that authorizes new direct spending or would make any changes to mandatory program statutes must be scored by CBO (projected changes in spending) over the 10-years of the baseline; increases in spending must be offset by reducing spending elsewhere or paired with revenue increases. The political effect of these provisions is to create a zero-sum scenario where increases in the policies for an interest or faction, or new policies or interests with policy ideas, would have to offset by decreasing policies for other interests or factions. For example, changes that increased the cost of farm programs would have to be offset by reductions in the cost of conservation, crop insurance, or food assistance.
Discussion
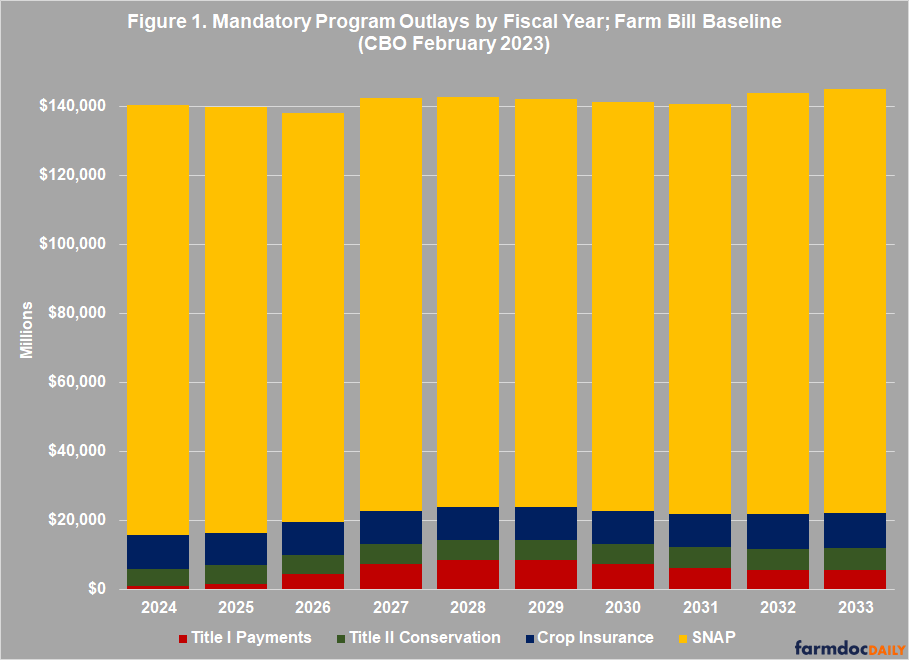
Overall, the 10-year baseline for the Farm Bill would be from fiscal year 2024 through fiscal year 2033, but CBO does provide actual outlays for FY2022 and estimated for FY2023, which began October 1, 2022. The 10-year baseline (FY2024-2023) for the Farm Bill is projected to be over $1.4 trillion, or roughly $140 billion each fiscal year. Food assistance through the Supplemental Nutrition Assistance Program (SNAP) accounts for 85% of the projected Farm Bill spending. For farmers, the largest share is for crop insurance (7%). Figure 1 graphs the CBO projections for the Farm Bill Baseline. As noted above, this is the amount available to the House and Senate Agriculture Committees for reauthorizing a Farm Bill.
(1) Title IV: Supplemental Nutrition Assistance Program (SNAP)
As of this writing, CBO has not provided updated details for the SNAP baseline; the spending projections for SNAP are included in the total spending projections (Subfunction 605, CBO, Spending Projections by Budget Account). For the ten fiscal years (FY 2024-2033) in the baseline, SNAP is expected to spend $1.2 trillion ($120.5 billion per FY) in direct assistance for the purchase of food by low-income individuals and households. This is an increase in the estimated spending for SNAP compared to the May 2022 Baseline. Figure 2 charts the 2023 baseline data (bars) and includes the projections from the May 2022 Baseline (area) for comparison purposes. More information in the increases, such as participation projections and benefit payments, await further details from CBO.
For some initial perspective on the increases in SNAP spending, CBO projects an increase in FY2024 ($14.7 billion) that is roughly equal to what was spent on the Market Facilitation Program in 2019 ($14.2 billion). Additionally, the total increase in SNAP spending for the next five fiscal years ($74.4 billion) is less than total spending on ad hoc and supplemental farm payments, including MFP and CFAP pandemic assistance, for the four fiscal years 2018 through 2021 ($75.9 billion), as reported by USDA’s Economic Research Service (ERS, Government Farm Program Payments).
(2) Title I: Commodities Programs
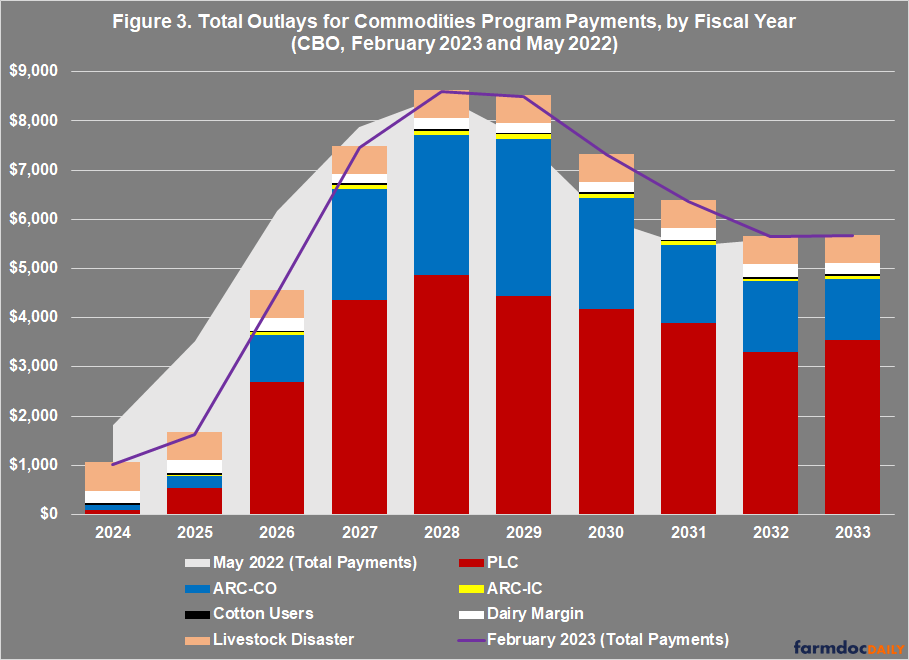
For the Title I Commodities Programs, CBO projects a 10-year (FY2024 to 20233) total of spending just above $57 billion. These programs include the Price Loss Coverage (PLC) and Agriculture Risk Coverage (ARC) programs, as well as support for dairy farmers and disaster assistance for livestock and tree producers. Figure 3 charts the February 2023 baseline projections (purple line), including by program (stacked bars), and includes a comparison with the May 2022 Baseline projections (area). The Price Loss Coverage (PLC) program remains the largest Title I program and a future article will break down the spending projections in these programs further. For FY2024 through FY2027, CBO estimates a reduction in spending on these programs, but an increase in the outyears (FY2029 to FY2033).
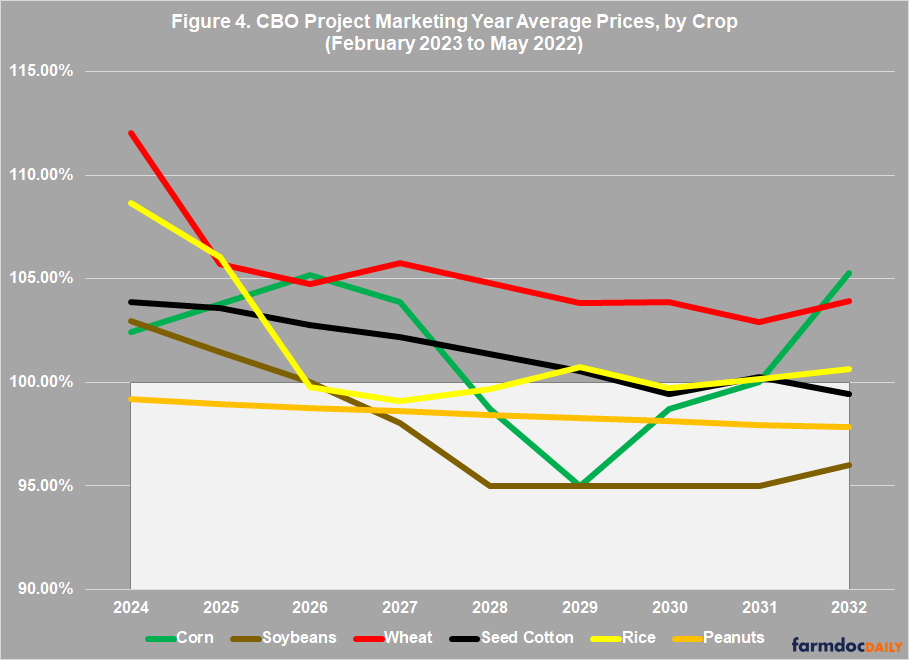
Not surprisingly, the changes in expected spending are tied to revisions in price forecasts for most of the major commodities and especially for wheat. Figure 4 compares the CBO forecasts for marketing year average (MYA) prices in the February 2023 baseline to the May 2022 baseline; the area would indicate projected prices in the February 2023 Baseline at or below the projected prices in the May 2022 Baseline. For example, CBO projects notably lower prices for soybeans in the outyears (after FY2028) at $9.50 per bushel. That price, however, remains well above the statutory reference price of $8.40 per bushel and even the effective reference using the escalator provision created in the 2018 Farm Bill (equal to 85% of the five-year Olympic moving average, not to exceed 115% of the statutory reference) which reaches $9.66 per bushel in FY2025 through FY2027 (see e.g., farmdoc daily, February 7, 2023). This impacts projected spending on soybeans, which is expected to be $0 in FY2024 and $1.1 billion in FY 2028 and 2029.
(3) Title II: Conservation
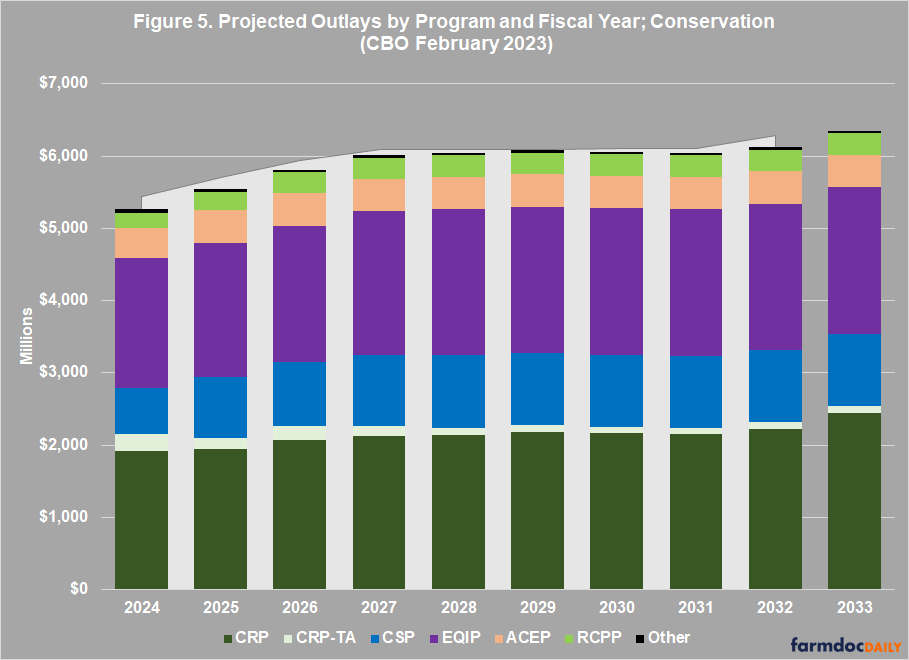
CBO projects relatively little change in total conservation program spending in the February 2023 Baseline as compared to the May 2022 projections. Figure 5 graphs the outlays by conservation program and fiscal year (stacked bars) with a comparison to the total projected in May 2022 (area). The Conservation Reserve Program (CRP, dark green) remains the largest program in terms of spending, followed by the Environmental Quality Incentives Program (EQIP, purple) which provides cost-share assistance for conservation practices on working lands. Note that the Conservation Stewardship Program (CSP, blue) is the third largest and provides 5-year contracts with annual payments for increasing or improving conservation. It was changed significantly in the 2018 Farm Bill and that change has taken over such that the baseline no longer includes spending under the 2014 version of the program. Finally, the Agricultural Conservation Easement Program (ACEP, pink) and the Regional Conservation Partnership Program (RCPP, light green) round out the programmatic spending in Title II.
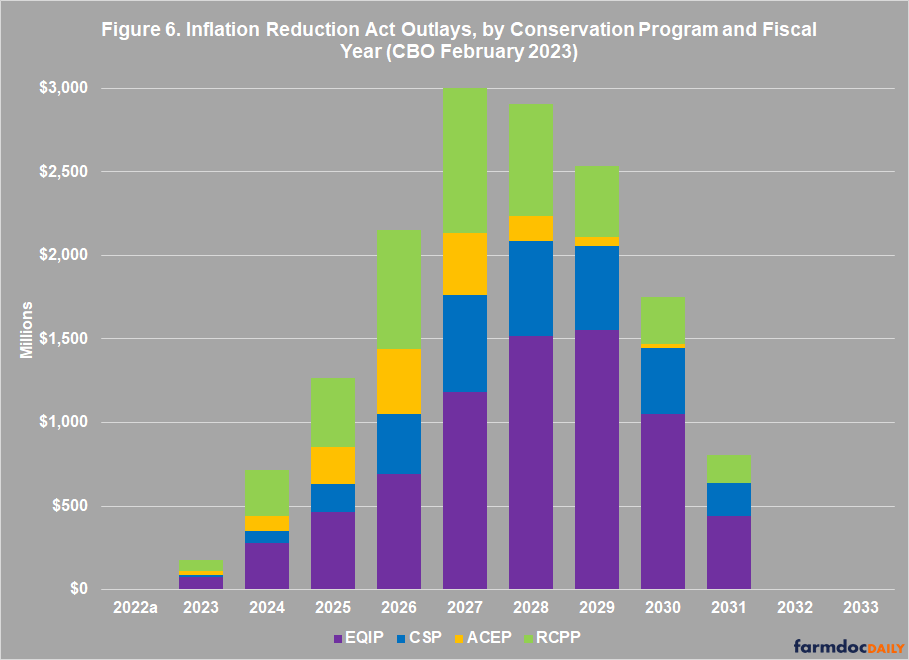
As discussed previously, the Inflation Reduction Act of 2022 provided a multi-year appropriation to some of the conservation programs of roughly $18 billion (see e.g., farmdoc daily, August 11, 2022). CBO has included projected outlays for the Inflation Reduction Act spending for EQIP, CSP, ACEP and RCPP. Figure 6 graphs the projected outlays under that funding. Notably, CBO projects that $15.3 billion of the appropriated funding will be spent by FY2031.
Note that Inflation Reduction Act funds are not included in the Title II (or farm bill) baseline projections. They are a distinct and separate funding stream into the underlying programs. What this means in practical terms is that those funds will only impact the baseline if they are rescinded as offsets to pay for increased spending in the baseline. Using those funds for an offset, however, is likely to be complicated by multiple factors.
(4) Crop Insurance
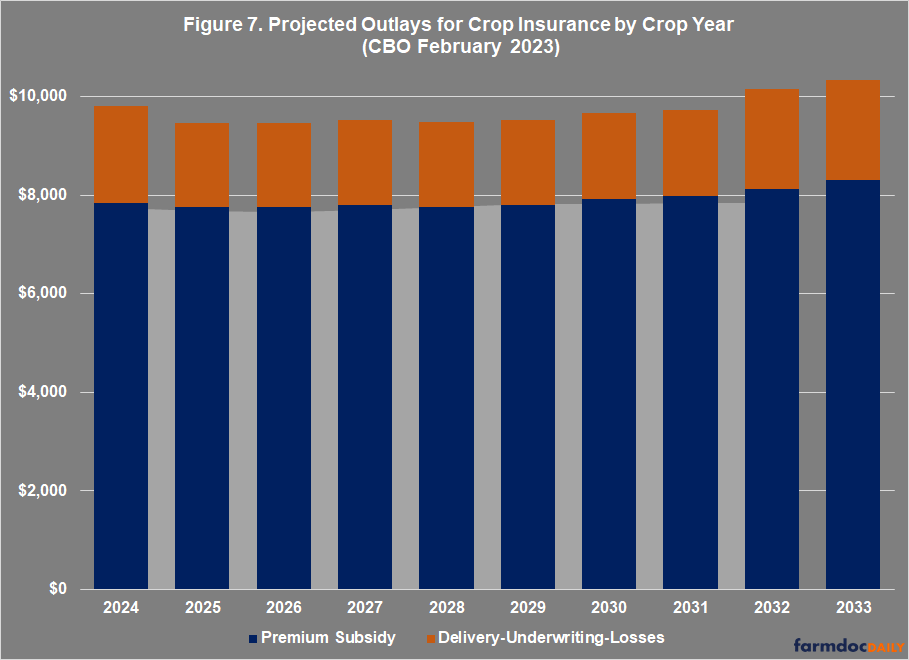
Finally, Figure 7 graphs the projected spending for the crop insurance baseline and highlights the outlays for premium subsidy (navy) and combines all other costs of the program, including delivery costs (Administrative and Operating subsidies), underwriting gains or losses and excess losses. This amount is also compared to the May 2022 projections for the total costs of crop insurance, also on a crop year basis. CBO projects crop insurance to cost above $97 billion over 10 years which insures estimated total liabilities in excess of $120 billion each crop year.
In general, crop insurance cost projections have increased and some of that is likely due to higher crop prices, as well as expectations for losses on those more expensive crops. CBO projects roughly $10.5 billion in indemnities each crop year, with reported indemnities in the 2022 crop year exceeded $18 billion.
Concluding Thoughts
Under budget rules currently in place, a farm bill reauthorization debate becomes a zero-sum contest under the Congressional Budget Office spending forecasts known as the baseline. Increasing the expected costs of any program (known as the CBO score) in a farm bill requires an offset of that cost to maintain an estimate of budget neutrality. This has become one of the most dominant factors in the development of food and agricultural programs and policies; these matters have drastically complicated farm bill politics. If Congress reauthorizes the Farm Bill in 2023, the recently released CBO Baseline projections will have a substantial impact on the negotiations and any changes. This article has provided a view of that effort based on an initial look at the CBO Baseline.
References
Congressional Budget Office. Details About Baseline Projections for Selected Programs. https://www.cbo.gov/data/baseline-projections-selected-programs
Congressional Budget Office. Federal Debt and the Statutory Limit, February 2023. https://www.cbo.gov/publication/58906
Coppess, J. "Federal Budget Discipline and Reform: A Review and Discussion, Part 1." farmdoc daily (8):218, Department of Agricultural and Consumer Economics, University of Illinois at Urbana-Champaign, November 29, 2018.
Coppess, J., K. Swanson, N. Paulson, C. Zulauf and G. Schnitkey. "Reviewing the Inflation Reduction Act of 2022; Part 1." farmdoc daily (12):119, Department of Agricultural and Consumer Economics, University of Illinois at Urbana-Champaign, August 11, 2022.
Schnitkey, G., C. Zulauf, N. Paulson and J. Baltz. "2023 and 2024 Effective Reference Prices and the Next Farm Bill." farmdoc daily (13):21, Department of Agricultural and Consumer Economics, University of Illinois at Urbana-Champaign, February 7, 2023.
Disclaimer: We request all readers, electronic media and others follow our citation guidelines when re-posting articles from farmdoc daily. Guidelines are available here. The farmdoc daily website falls under University of Illinois copyright and intellectual property rights. For a detailed statement, please see the University of Illinois Copyright Information and Policies here.


