


Crop Insurance Performance and the FAST Summary of Business Tool
We have recently released a FAST tool that summarizes payout information from crop insurance products (click here for the tool). We use the Excel tool to evaluate the performance of select counties in Illinois. For corn, the 2012 drought year had a significant influence on performance. The drought year had less of an impact on soybeans. In northern and central Illinois, protecting against large losses from drought years is the main motivation for using crop insurance.
Summary of Business and a FAST Tool
The Risk Management Agency (RMA) provides data on the performance of Federally-regulated and subsidized products through the Summary of Business (SOB). SOB data are disaggregated to the county level and can be used to evaluate crop insurance performance over time for a different crop, insurance plan, and practice combinations. Data are available down to the coverage level of specific plans.
SOB data has been summarized and made available in a FAST Microsoft Excel spreadsheet called the Crop Insurance Summary of Business Tool. Users of the tool can make county, crop, and insurance plan selections. The tool will show acres insured, premiums, payouts, net costs, and loss ratios by year.
Net Payments on Corn in Logan County, Illinois
Table 1 shows data pulled from the FAST spreadsheet for corn in Logan County, Illinois. Table 1 shows acres insured, farmer-paid premiums, insurance payments, and net payments for RP policies at the 85% coverage level. RP is the most popular crop insurance product used on 90% of insured acres in Logan County. The 85% coverage level represents 71% of acres insured with RP in Logan County.
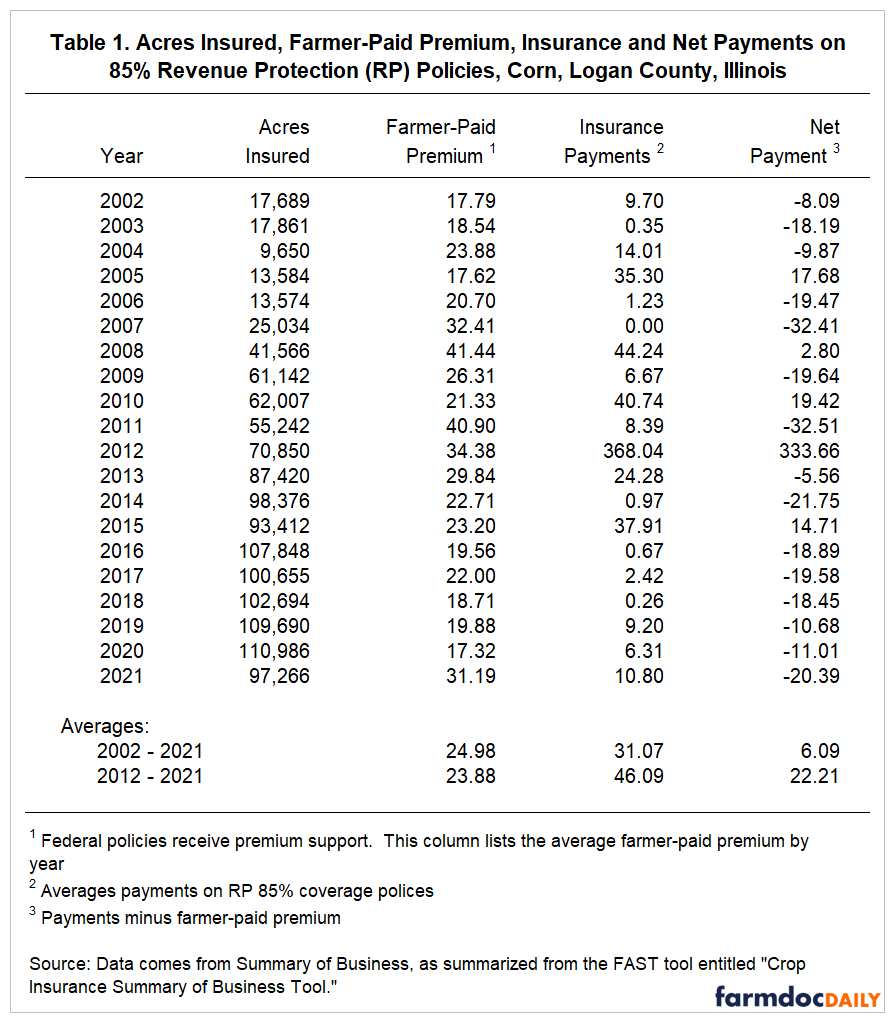
Farmer-paid premiums represent the premium paid by the farmer. In addition to farmer-paid premiums, the Federal government supports crop insurance premiums on Federally-regulated products. Subsidy rates are shown in a May 5, 2016, farmdoc Daily article. Those subsidy rates have remained the same for the time perios shown in Table 1, except for rates on enterprise units. Enterprise unit subsidy rates were increased in the 2012 Farm Bill.
Farmer-paid premiums paid in Logan County vary yearly, with much of the variability due to changes in projected prices and volatilities. Higher projected prices and volatilities increase premiums. Farmer-paid premiums range from a low of $17.32 per acre in 2020 to a high of $40.90 in 2011. From 2002 to 2021, farmer-paid premiums averaged $24.98 per acre. During the last ten years — 2012 to 2021 — farmer-paid premiums averaged $23.88 per acre.
Insurance payments averaged $31.07 per acre from 2002 to 2012. For the last ten years, insurance payments averaged $46.09 per acre. By far, the year with the highest payments is 2012, the drought year, with an average payment of $368.04 (see Table 1). The next highest payment was $44.24 per acre in 2008.
Net payments equal payments minus farmer-paid premiums. Positive values mean that insurance payments exceeded premiums and vice versa. Given higher insurance payments in 2012, net payments were positive and high, at $333.66 per acre. Since 2012, average payments exceeded farmer-paid premiums only in 2014, when net payments averaged $14.71.
Net payments averaged $6.09 per acre from 2002 to 2021 and $22.21 per acre from 2012 to 2021. As one would expect, 2012 is critical in net payments averaging positive. Without 2012, net payments on 85% RP policies in Logan County would have averaged -$11.15 per acre from 2002 to 2021 and -$12.40 per acre from 2012 to 2021.
Note that Table 1 shows averages. Some farmers in individual years had much higher payments than the averages shown in Table 1, and many farmers would have no insurance payments.
Corn Across Illinois
Logan County is in central Illinois, and results for Logan county are similar to many central Illinois counties. Northern and southern Illinois counties have payments that vary from central Illinois counties. Figure 1 shows net payments for:
- Northern Illinois — DeKalb County, 85% coverage level,
- Central Illinois — Logan County, 85% coverage level, and
- Southern Illinois — Saline County, 75% coverage level.

A 75% coverage level is used for Saline County, as coverage levels tend to be lower in southern Illinois (see farmdoc daily, December 1, 2020).
In both Logan and Saline Counties, 2012 had the largest payment by far. Counties in southern Illinois felt the largest impact of the 2012 drought, followed by central Illinois. The 2012 drought did not damage yields as much in DeKalb county. As a result, net payments averaged only $70.83 in DeKalb County, Illinois, compared to $333.66 in Logan County and $63.34 per acre in Saline County, Illinois. Unlike the northern and central Illinois counties, northern Illinois had an adverse year in 2019 due to wet weather. As a result, net payments averaged $89.55 per acre in 2019.
Soybeans
Soybeans have differing payment patterns than corn. Table 2 shows insurance results for 85% RP policies on soybeans in Piatt County, a county in Central Illinois. Net payments in the drought year were $8.14 per acre, much lower than payments for corn. For soybeans, the highest net payment occurred in 2008, a wet year. Since 2012, net payments have been negative for Piatt County. Net payments averaged -$3.92 per acre from 2002 to 2021 and -$6.94 per acre from 2012 to 2021.

Figure 2 shows three Illinois counties:
- Northern Illinois — Bureau County, 85% coverage level,
- Central Illinois — Piatt County, 85% coverage level, and
- Southern Illinois — Washington County, 75% coverage level.

Payments for Bureau and Piatt Counties show the same trends. In both these counties, 2008 had the highest net payments. In most years, net payments are negative. Overall, soybeans had very low losses in Illinois, resulting in negative net payments (see farmdoc daily, January 17, 2023).
For Washington County in southern Illinois, the highest net payments were $130.30 per acre in 2012, the drought year. The drought was exceedingly severe in southern Illinois, resulting in poor yields for both corn and soybeans. Net payments from 2002 to 2021 averaged $9.84, with the drought year.
Summary
The six counties highlighted above are representative of results for Illinois and illustrate differences across regions of Illinois. Users can download the Crop Insurance Summary of Business Tool and evaluate their own counties. The tool includes corn, soybean, and wheat in all states.
In Illinois, the 2012 drought year greatly impacted average performance over time, particularly for corn. Since the drought had less of an impact on soybeans, overall net payments averaged lower for soybeans as compared to corn.
References
Schnitkey, G., C. Zulauf, N. Paulson and J. Baltz. "Crop Insurance for Soybeans: The Low Loss Ratio Concern." farmdoc daily (13):8, Department of Agricultural and Consumer Economics, University of Illinois at Urbana-Champaign, January 17, 2023.
Schnitkey, G., N. Paulson, C. Zulauf and K. Swanson. "Coverage Levels on RP: Relationship to Premium Levels." farmdoc daily (10):206, Department of Agricultural and Consumer Economics, University of Illinois at Urbana-Champaign, December 1, 2020.
Disclaimer: We request all readers, electronic media and others follow our citation guidelines when re-posting articles from farmdoc daily. Guidelines are available here. The farmdoc daily website falls under University of Illinois copyright and intellectual property rights. For a detailed statement, please see the University of Illinois Copyright Information and Policies here.