


More Corn Acres and the Prospect of Large Stocks and Low Prices
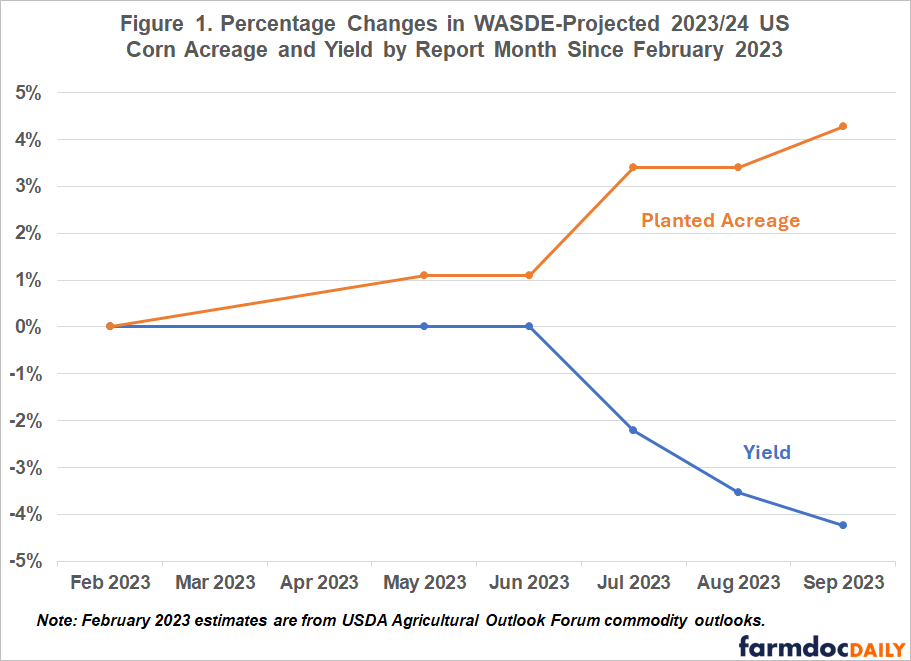
As fall harvest approaches in the US corn belt, the corn market outlook for the 2023/24 marketing year is coming into focus. USDA released its World Agricultural Supply and Demand Estimates (WASDE) on Tuesday, September 12 showing relatively small changes in projected 2023 US corn and soybean production. Yield forecasts for the upcoming harvest continue to decline. However, increases in corn planted acreage estimates have offset the impact of lower corn yield on production. Figure 1 shows USDA-projected corn planted acreage for the current marketing year has increased just over 4% relative to estimates produced back in February while projected yield has similarly fallen just more than 4%. This article reviews the USDA Farm Service Agency (FSA) reported crop acreage enrolled in farm programs released last week and used to update WASDE planted acreage estimates. We consider whether further changes to 2023 planted acres are likely.
The large US corn crop anticipated in USDA’s September estimates raises the prospect of higher stocks and a ‘return to normal’ for corn prices. The open question remains: what is the normal price level for corn in a period of abundant stocks? We discuss what current corn production estimates imply for 2023/24 ending stocks and prices in current and future marketing years. The current 2023/24 projection for a US corn stocks-to-use ratio of about 15% has historically implied much corn price levels below $4 per bushel. However, the current market has consistently associated a roughly trend-level production forecast for corn with price levels of about $4.80 per bushel. This nominal price level may be one of many implications of the current elevated inflation and higher interest rates for US agricultural markets. In general, part of feeling out the return to normal in the corn market will be working out prices and calendar spreads settle out in the absence of low interest rates to lubricate the wheels of the supply chain.
Using New Acreage Data to Project Final Planted Acres
The September WASDE report increased estimated corn planted acreage from 94.1 to 94.9 million acres. The updated number reflects the incorporation of concurrently released data from FSA on reported crop acreage enrolled in farm programs. The 0.8-million-acre increase announced last week was somewhat surprising when compared to analysts’ pre-report acreage estimates. The average trade guess called for an increase of just 0.1 million acres and even the highest reported analyst’s estimate suggested an increase of 0.7 million acres. Our own prior analysis using August FSA data suggested acres could be as much as 1.5 million acres higher.
A prior farmdoc study (Irwin and Hubbs 2020) showed that, as early as August, FSA numbers offer a fairly accurate projection of the final acreage estimates reported in the NASS Annual Summary in January. The Irwin and Hubbs two-step approach involves adjusting the FSA September estimate for both the possibility of additional acreage sign ups and differences between FSA and NASS acreage numbers. Here, the relationships within that two-step approach are estimated based on data for the most recent two years.
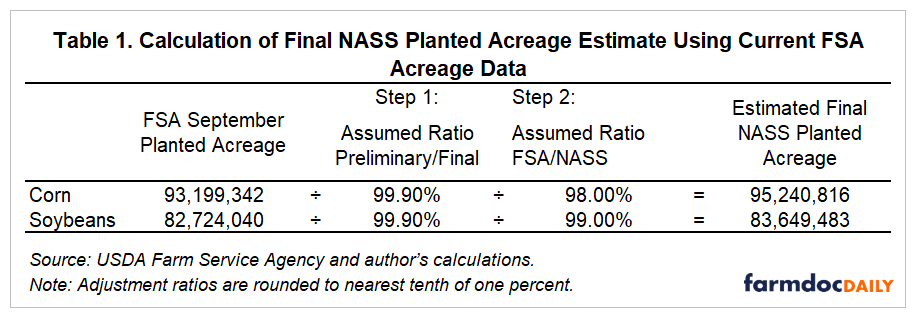
We begin with th just released FSA numbers are reported as of September 1 shown in table 1. First, with respect to the FSA data, corn and soybean acreage enrolled in farm programs by September average approximately 99.9% of that in January; this reflects modest increases in enrollment over the season. Second, January FSA acreage numbers for corn and soybeans respectively average 98.0% and 99.0% of NASS estimates in the January Annual Summary. Our corn acreage estimate of 95.2 million acres suggests the possibility of further small increases in both corn and soybean planted acreage for the 2023 crop year. The 95.1 million estimate is lower than that we produced using a similar approach and August FSA data. This suggests we are homing in on a final corn planted acreage number of approximately 95 million acres, us from above and USDA from below. The soybean planted acreage estimate produced by the same approach is roughly equal to the current WASDE projection of 83.6 million acres.
More Corn Acres and the Balance Sheet
Higher corn planted acres have offset declines in projected yields observed during the 2023 growing season. Estimated US corn production for 2023 (shown in Table 2) is currently 15.134 billion bushels, up 23 million bushels from the previous month’s estimate. If this number holds, it would be close to a record US corn crop in absolute volume. Further acreage increases or reversal in the trend of lower yield forecasts could easily mean record US corn production in 2023.
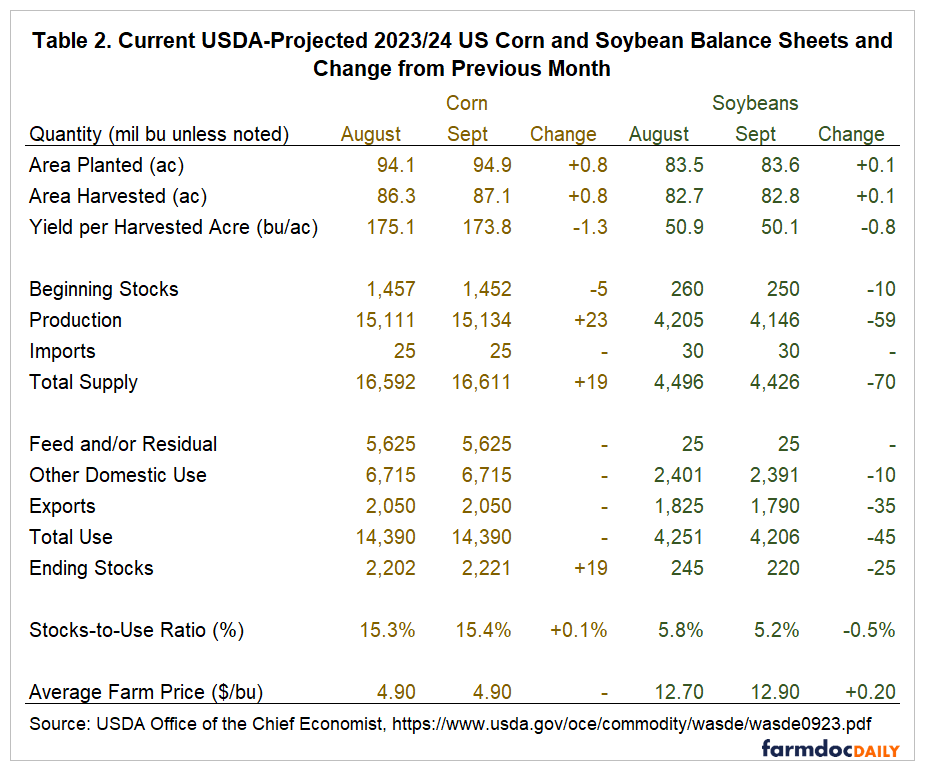
Estimated US corn production is roughly equal to projections made earlier in the year, albeit with lower acres and higher yield. Since then both production and use projections have changed little. The consequence is a projected 2.2 billion bushel ending stocks number and projected ending stocks to use ratio of 15.4%. We last observed US corn ending stocks over 2 billion bushels in the 2016/17-2018/19 marketing years. Average farm prices received during that period were below $4.00 per bushel.
Current projected corn use is only modestly lower than initial estimates made in May 2023. Table 2 shows the September WASDE report may no changes to corn use. This is in spite of the continued decline in projected old-crop corn exports for the 2022/23 marketing year which are now 1.665 billion bushels, 19% lower than the current new-crop 2023/24 export forecast. This dramatic jump in US corn exports seems optimistic in the current environment. In spite of the prospect of sustained Chinese corn imports, (See: Lohmar) corn exports from South American are anticipating continued growth this year and next, especially as Argentina’s production is expected to rebound from a 2023 drought. (See: Carino, 2023)
Discussion
The US corn market is adjusting to the idea of a relatively large crop and big ending stocks in 2023/24. Corn futures price levels have settled in the $4.70 to $4.90 per bushel range for the harvest-time December 2023 contract. Calendar spreads show positive carry to incentivize storage of the 2023 harvest into the latter half of the marketing year. The spread between the July 2024 and December 2023 contracts is currently about 30 cents per bushel, slightly larger than levels seen earlier in the growing season.
Current long-run projections for US corn stocks levels such as those from the Food and Agricultural Policy Research Institute at the University of Missouri expect 2-billion-plus bushel corn ending stocks into foreseeable future (See: FAPRI-MU 2023). This begs the question: In a world where US corn stocks are relatively abundant, what is the long run ‘normal’ price level? Historical observation suggests it is lower than the current level of about $4.80 per bushel.
Elevated economy-wide price inflation and higher interest rates are major differences between the last period of high US corn ending stocks in 2016-2019 and today. Corn prices of $4.80 may appear elevated in nominal terms but are much closer to past experience when adjusted for inflation. At the same time, pricing a bushel of grain today relative to its value later in the marketing year depends greatly on interest rates as a measure of the time value of money. How farmers, merchandisers, and others who hold commodity inventories (including the balance sheet ending stocks discussed above) will behave when interest rates are high is something to watch through the remainder of this marketing year.
References
“Baseline Update for U.S. Agricultural Markets.” FAPRI-MU Report #03-23. https://fapri.missouri.edu/wp-content/uploads/2023/09/2023-Baseline-Outlook-Update.pdf
Carino, Meghan M. “The U.S. is no longer world’s leading exporter of corn.” Marketplace, Aug 31, 2023. https://www.marketplace.org/2023/08/31/the-u-s-is-no-longer-worlds-leading-exporter-of-corn/
Irwin, S. and T. Hubbs. "Using Preliminary FSA Data to Project Final Planted Acreage for Corn and Soybeans." farmdoc daily (10):156, Department of Agricultural and Consumer Economics, University of Illinois at Urbana-Champaign, August 27, 2020.
Lohmar, Bryan. “Will China’s Corn Imports Continue?” Volume 38. Quarter 3. https://www.choicesmagazine.org/choices-magazine/submitted-articles/will-chinas-corn-imports-continue
Disclaimer: We request all readers, electronic media and others follow our citation guidelines when re-posting articles from farmdoc daily. Guidelines are available here. The farmdoc daily website falls under University of Illinois copyright and intellectual property rights. For a detailed statement, please see the University of Illinois Copyright Information and Policies here.