


The Post 1990 New Normal: Stable Real US Crop Prices
Inflation-adjusted real US crop prices declined over much of the 20th Century. The decline ended around 1990. Over the subsequent 30 years, real crop prices have exhibited no trend. The shift from declining to stable real crop prices coincided with the emergence of a tighter world supply-demand balance for crops that continues until now. Compared with the 20th Century and assuming other factors remain the same, stable real crop prices imply a potential for higher inflation and interest rates as well as lower economic growth. Stable real crop prices also reduce the argument for fixed minimum prices in the US crop safety net since general price inflation is less likely to negatively impact crop returns.
Data and Procedures
Real US crop prices are examined beginning with 1912, the first year the US Department of Agriculture (USDA) computed a US all crop price index. The index is available from the Quick Stats data website maintained by USDA, National Agricultural Statistics Service. The data ends with the latest available calendar year, 2022. The US all crop price index is deflated by the US Consumer Price Index (CPI). Source for CPI is the FRED Economic Data website maintained by the Federal Reserve Bank of St. Louis.
Real Crop Prices
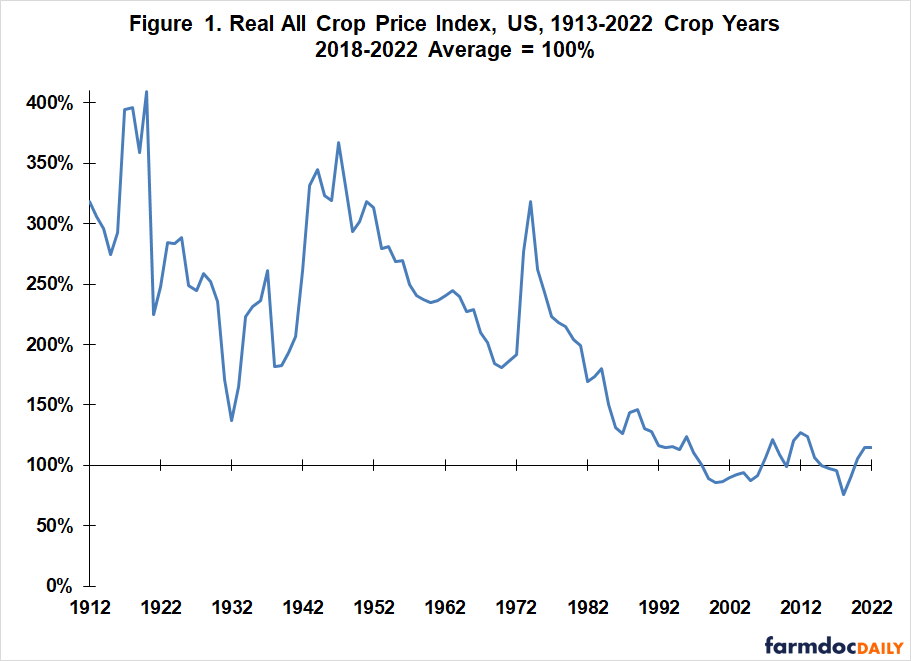
To facilitate discussion, the real US all crop price index is expressed as a percent of its 2018-2022 average value (see Figure 1). The highest real US crop prices occurred just after World War I in 1920 at 409% of the 2018-2022 average. Real crop prices then fell precipitously through 1932, the midst of the Great Depression. New Deal farm programs reduced crop production, initiating an increase that continued through World War II as US farm production expanded to supply the war effort and offset disruptions in European and Asian farm production. The real US all crop price index reached 345% in 1944. It then began a prolonged decline, passing the 1932 low in 1991. Between 1944 and 1991, the annual decline averaged 4.7 percentage points per year. Since 1991 US crop prices and consumer price inflation have moved together. This 31 year period of stability in US real crop prices is unprecedented over the 110 years in this analysis.
Changing Supply-Demand Balance
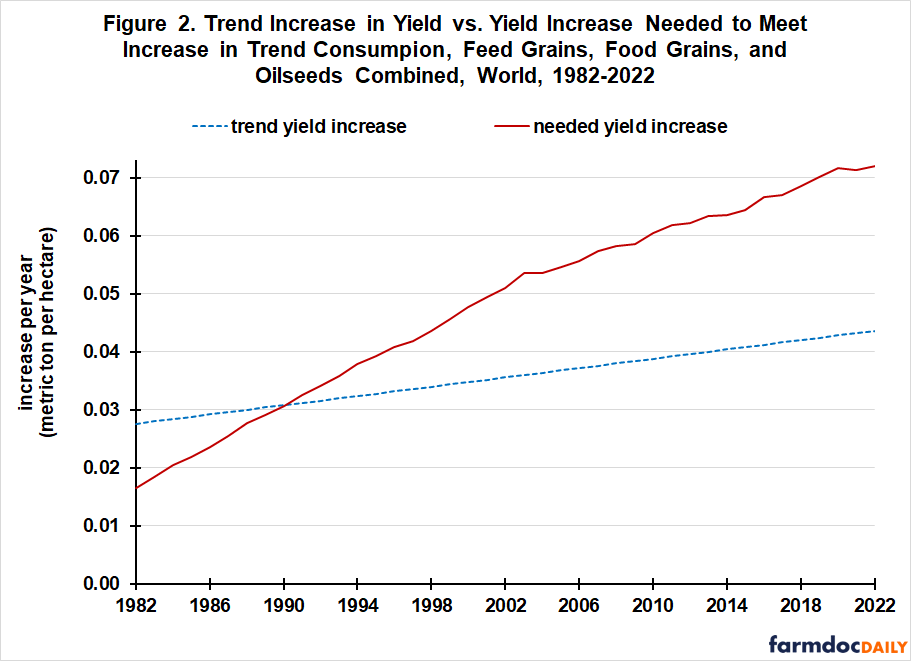
What also makes the post 1990 stability in US real crop prices intriguing is that it coincides with a change in the supply-demand balance for world feed grains, food grains, and oilseeds. In 1991, the trend increase in combined yield of these field crops no longer was able to satisfy the increase in combined trend consumption of these field crops assuming harvested land remained the same as in the previous year (see Figure 2). This change implies a tighter supply-demand balance and less downward pressure on grain and oilseed prices. It is thus consistent with the end of the decline in real US crop prices.
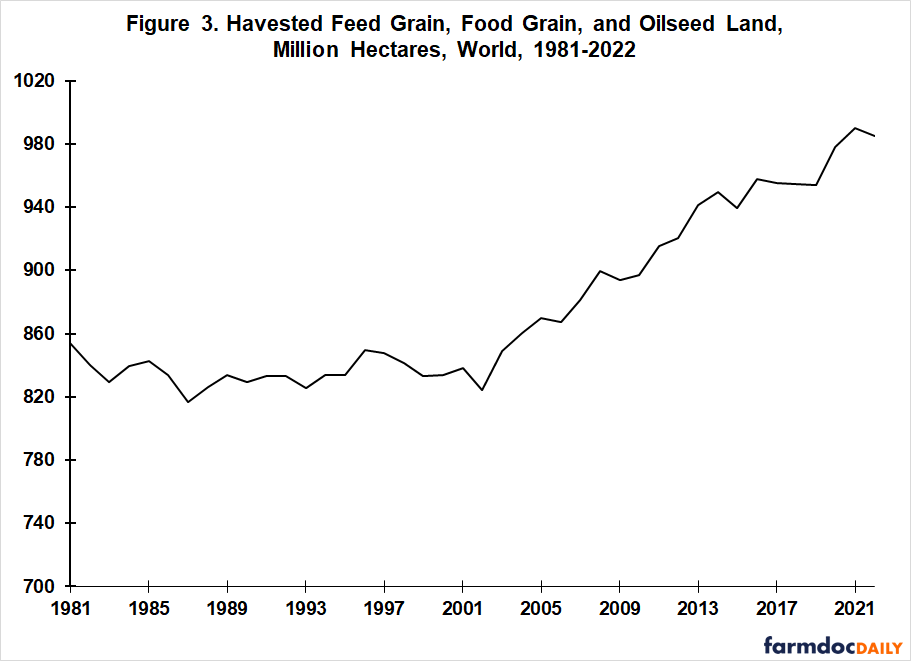
Also consistent with Figure 2 is the change in world combined harvested land of feed grains, food grains, and oilseeds. Harvested land decreased slightly in the 1980s, increased slightly in the 1990s, then began a larger, steady increase in the early 2000s (see Figure 3) as the increase in yield needed to satisfy the increase in combined trend consumption of these crops increasingly exceeded the increase in their combined trend yield.
The data and analysis used to generate Figures 2 and 3 are described in farmdoc daily, November 21, 2022. Note that the two yield trends in the November 21, 2022 article were computed separately for feed grains, food grains, and oilseeds.
Discussion
- Inflation adjusted real US crop prices have exhibited no trend over the last 30 years after declining during much of the 20th Century.
- The change in behavior of real US crop prices is intriguing because it aligns with a tighter supply-demand balance for world grain and oilseed crops that also emerged in the early 1990s.
- A tighter supply-demand balance provides a rationale for why stable US real crop prices may extend into the near future, although it is no guarantee.
- Stable real crop prices mean that crop prices will not dampen consumer price inflation, as they did during much of the 20th Century. Higher interest rates are implied, assuming other factors remain the same and the Federal Reserve continues to set its target interest rate as a mark-up to inflation.
- The need for more cropland to cover the shortfall in trend increase in yield relative to the trend increase in consumption exacerbates the conflict between land for crops and the desires to limit conversion of forest to crop land as well as to convert existing crop land to environmental uses, including green renewable energy.
- The decline in real US crop prices in the 20th Century was associated with a similar percentage point decline in the share of US personal consumption expenditures spent on food and beverages for off-premise consumption (which is largely consumption of food at home). Using data from FRED, this share declined from 19.4% in 1959 (first available) to 10.2% in 1990. It has stabilized at 7.5% to 8.5% since 2000. The decline allowed a shift in share of spending to other US economic sectors. Disappearance of this shift may dampen US economic growth.
- Stability in real US crop prices reduces the argument for fixed minimum prices in the US crop safety net because general price inflation is less likely to negatively impact farm returns.
References and Data Sources
Federal Reserve Bank of St. Louis, FRED Economic Data. September 2023. https://fred.stlouisfed.org/
US Department of Agriculture, National Agricultural Statistics Service. September 2023. Quick Stats. https://quickstats.nass.usda.gov/
Zulauf, C. “US Feed Grain, Oilseed, and Food Grain Land since 1980.” farmdoc daily (12):176, Department of Agricultural and Consumer Economics, University of Illinois at Urbana-Champaign, November 21, 2022.
Disclaimer: We request all readers, electronic media and others follow our citation guidelines when re-posting articles from farmdoc daily. Guidelines are available here. The farmdoc daily website falls under University of Illinois copyright and intellectual property rights. For a detailed statement, please see the University of Illinois Copyright Information and Policies here.