


The Post 2006 New Normal: US Grain and Oilseed Profitability
US grains and oilseeds as a group have earned a cumulative private market net return since 2006 of +4%. In contrast, over 1975-2006 private market net return was a -11% loss. The switch in profitability coincides with a tighter supply-demand balance. Yields no longer increase fast enough to meet the growth in use. This yield gap provides a rationale for why profitability may continue in the near future, although it is not a given. The profit transformation implies commodity program payments should be temporary, not continuous. It also raises the question, “Is crop insurance insuring too much risk?”
Cost of Production Data
USDA, ERS (US Department of Agriculture, Economic Research Service) computes cost of production per planted acre for barley, corn, cotton, oats, peanuts, rice, sorghum, soybeans, and wheat. ERS assigns a cost to all inputs except management, including an opportunity cost to unpaid labor and farmer-owned land. Thus, an economic cost is computed. Returns, both gross and net, are private market returns calculated using US cash price at harvest. Returns and costs from storing the crop are not included. Also not included are payments by government programs, including commodity, disaster assistance, conservation, and livestock programs, as well as indemnities from crop insurance. Crop insurance premiums paid by farms are not included in costs. Debate has surrounded ERS cost estimates since the beginning. We think their methodology is appropriate and their estimates reasonable, but encourage readers to examine the discussion of ERS methods in Zulauf, Langemeier, and Schnitkey (2020) and elsewhere to form their own opinion. ERS cost data are discussed further in Data Note 1.
Economic cost and private market net return per planted acre for each crop and year are multiplied by US acres planted to the crop for the year to obtain an estimate of the crop’s total US economic cost and private market net return for the year. The individual crop values are summed to obtain combined US economic cost and private market net return for the nine crops as a group for each year from 1975 through 2022. Planted acres are from Quick Stats (USDA, National Agricultural Statistics Service).
Combined Private Market Net Return
Between 1975 and 2006, the nine crops earned a combined profit from the private market at harvest in only 6 of the 32 years (see Figure 1). Cumulative private market net return was a loss of -11%. Since 2006, 9 of the 16 years have been profitable. Cumulative private market net return is +4% (+$80 billion in dollar terms). In addition, average loss during years with a loss was nearly 50% smaller after 2006: -16.2% before 2007 vs. -8.6% after 2006.

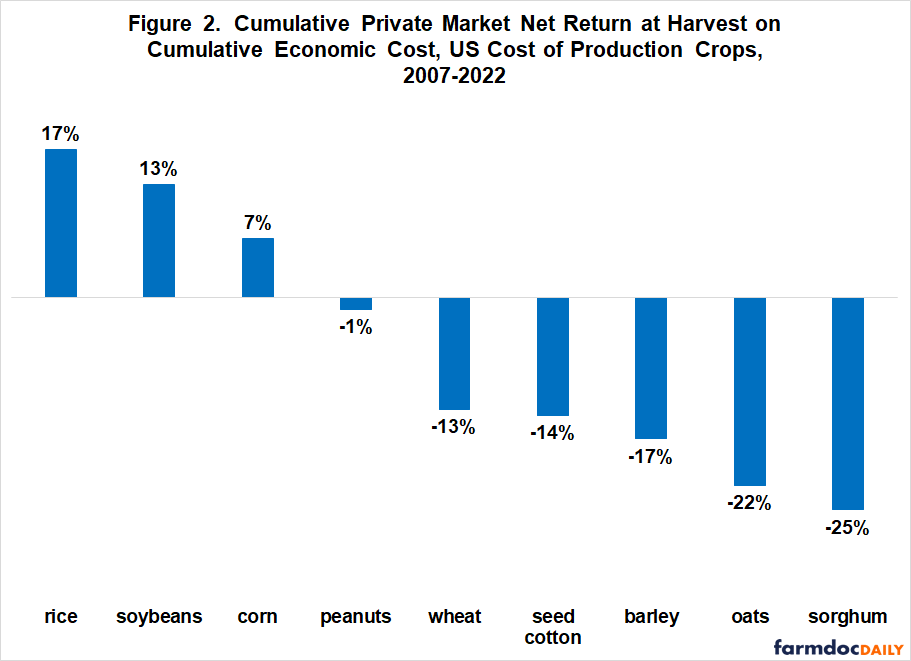
Private Market Net Return by Crop
Post 2006 economic profitability is not just about corn and soybeans (see Figure 2). Rice also has been profitable while peanuts essentially covered total economic costs. These four crops have accounted for 70% of acres planted to the nine crops since 2006.
Changing Supply-Demand Balance
The profit transformation is also intriguing because in the early 2000s, a tighter supply-demand balance emerged for US grains and oilseeds. Specifically, the increase in trend yield of US grains and oilseeds as a group dropped below the yield increase needed to supply the trend increase in their combined consumption (see Figure 3). Moreover, US grain and oilseed acres have been stable since 1985 (farmdoc daily, September 22, 2023). The tighter supply-demand balance implies upward pressure on prices and net returns, and is thus consistent with the change in economic return to producing US grains and oilseeds. For a discussion of the analysis used to generate Figure 3 see the farmdoc daily of November 21, 2022.

Discussion
Since 2006 US grain and oilseed production has earned a +4% cumulative private market profit over economic cost vs. a cumulative private market loss of -11% over 1975-2006. A charge for unpaid farm labor and farmer-owned land is included in these returns.
Corn, rice, and soybeans have individually covered economic costs since 2006, with peanuts near breakeven.
The transformation in private market economics of producing US grains and oilseeds is consistent with a tighter supply-demand balance that emerged in the early 2000s. US yields of grains and oilseeds are no longer increasing fast enough to cover the trend growth in use of US grains and oilseeds. This tighter supply-demand balance increases the likelihood that profits above economic costs can continue into the near future, although it is no guarantee.
The post-2006 profitability of US grain and oilseed production implies commodity programs should provide only temporary support. Current design of US commodity programs is consistent with temporary support, provided statutory reference prices are below total economic cost per output unit. Such is currently the case for the crops in this analysis, but a large range exists. Statutory reference price ranges from 6% less for rice to 37% less for sorghum to 69% less for oats relative to economic cost (farmdoc daily, June 28, 2023). A policy question is whether this range is too large.
Because crop insurance insures gross revenue at harvest, the profit transformation from an -11% loss to a +4% profit implies the effectiveness of crop insurance at insuring total economic cost has risen roughly 15 percentage points.
This change, combined with the wide variation in cost of production across crop farms (for example, see Illinois Farm Business Farm Management. 2017), raises the question, “Is US crop insurance now insuring too much risk?” Specifically, “Can the most efficient farms insure a profit at the higher crop insurance coverage levels?” Since efficiency and farm size are related, a related question is, “Does crop insurance favor survival of the largest US crop farms?” If the answers are ‘yes,’ “Is the US body politic comfortable with current crop insurance policy?”
Data Note 1
Quantities of inputs in ERS budgets are based on periodic surveys of farms. Input prices are updated annually using National Agricultural Statistics Service reports. Recommendations of an American Agricultural Economics Association Task Force were implemented beginning with the 1995 crop year. They were largely changes to the methods used to value an input, not the addition or removal of inputs. See ERS Documentation material for detailed discussion of the changes.
References and Data Sources
Illinois Farm Business Farm Management. 2017. 92nd Annual Summary of Illinois Farm Business Records. C13888-18. Bullock, D. and S. Steinbach. https://www.fbfm.org/publications.asp
US Department of Agriculture, Economic Research Service. October 2023. Cost of Production. https://www.ers.usda.gov/data-products/commodity-costs-and-returns/
U.S. Department of Agriculture, Economic Research Service. May 2023. Documentation: USDA Cost of Production Data. https://www.ers.usda.gov/data-products/commodity-costs-and-returns/documentation
US Department of Agriculture, National Agricultural Statistics Service. October 2023. Quick Stats. https://quickstats.nass.usda.gov/
Zulauf, C. “US Feed Grain, Oilseed, and Food Grain Land since 1980.” farmdoc daily (12):176, Department of Agricultural and Consumer Economics, University of Illinois at Urbana-Champaign, November 21, 2022.
Zulauf, C., J. Coppess, G. Schnitkey and N. Paulson. “Cost of Production and Farm Policy, Part II: Statutory Reference Prices.” farmdoc daily (13):118, Department of Agricultural and Consumer Economics, University of Illinois at Urbana-Champaign, June 28, 2023.
Zulauf, C., M. Langemeier, and G. Schnitkey. 2022. U.S. Crop Profitability and Farm Safety Net Payments since 1975. Journal of the American Society of Farm Managers and Rural Appraisers. Pages 60-69. https://www.asfmra.org/resources/asfmra-journal
Zulauf, C., G. Schnitkey, N. Paulson and J. Colussi. “Concentration of US Crops in Corn and Soybeans: Importance to Increasing US Production of Grains and Oilseeds.” farmdoc daily (13):173, Department of Agricultural and Consumer Economics, University of Illinois at Urbana-Champaign, September 22, 2023.
Disclaimer: We request all readers, electronic media and others follow our citation guidelines when re-posting articles from farmdoc daily. Guidelines are available here. The farmdoc daily website falls under University of Illinois copyright and intellectual property rights. For a detailed statement, please see the University of Illinois Copyright Information and Policies here.