World and Regional Trend Crop Yields in an Era of Climate Change
Reduced growth in yields over time might be one negative impact of climate change on crop production. World and regional corn, rice, soybean, and wheat yields are examined for crop years 1981-2022. While research has found negative yield impacts from climate change on more micro-scales, the overall result of this analysis finds that world and regional trend yields increased at a constant or increasing annual rate from 1981 to 2022. This finding suggests that aggregate world crop production has thus far been able to adapt to climate change impacts. Climate change is a crucial topic at COP28, the annual United Nations climate talks, running until December 12 in Dubai, in the United Arab Emirates.
Data
Corn, rice, soybean, and wheat yields were obtained for 1981/1982 (hereafter, first year is used) through 2022 crop years from the Production, Supply, and Distribution Online (PSD) database (U.S. Department of Agriculture, Foreign Agriculture Service) after the release of the November 9, 2023, World Agriculture Supply and Demand Estimates (WASDE). These crops are the world’s largest acreage grains and oilseeds. Yields were obtained for the world and 14 regions. The regions are the Caribbean, Central America, East Asia, European Union, Former Soviet Union – 12, Middle East, North Africa, North America, Oceania, Other Europe, South America, South Asia, Southeast Asia, and Sub-Saharan Africa. A region had to have yields for all years to be included in the analysis.
Procedures
One concern is that climate change is impacting the sustainability of trend yield increases (see Data Note 1). A potential negative impact of climate change on yields could be a decline, or a slowing, in the annual rate of increase – often referred to as yield trend. Statistical tests were conducted by fitting time trends to observed yields. Two-time trend models are estimated: a linear time trend and a linear plus squared time trend. Adding the square term allows the estimated trend to decrease or increase. To assess if the rate of change in trend yields is changing, an F-test is conducted of the R2 (i.e. explanatory power) of the two-time trend models. If the R2 of the linear plus squared time trend is not higher than the R2 of the linear time trend with 95% statistical confidence, then the linear time trend is used. This finding implies that the rate of change in yield has remained constant over 1981-2022. If the R2 of the linear plus squared time trend is higher than the R2 of the linear time trend with 95% statistical confidence, then the linear plus squared time trend is used. The rate of change may increase or decrease or both over the analysis period. The rate of change over the last five years is used as the current rate of change.
Based on the statistical tests and models, each crop/geography combination is classified as:
- decline — trend yield declined over time (could be linear or linear plus squared model)
- constant — linear model is significant; trend increased at a constant rate per unit of output
- inc inc — linear plus square model is significant; trend increased at an increasing rate
- inc dec — linear plus square model is significant; trend increased at a decreasing rate
World Yield
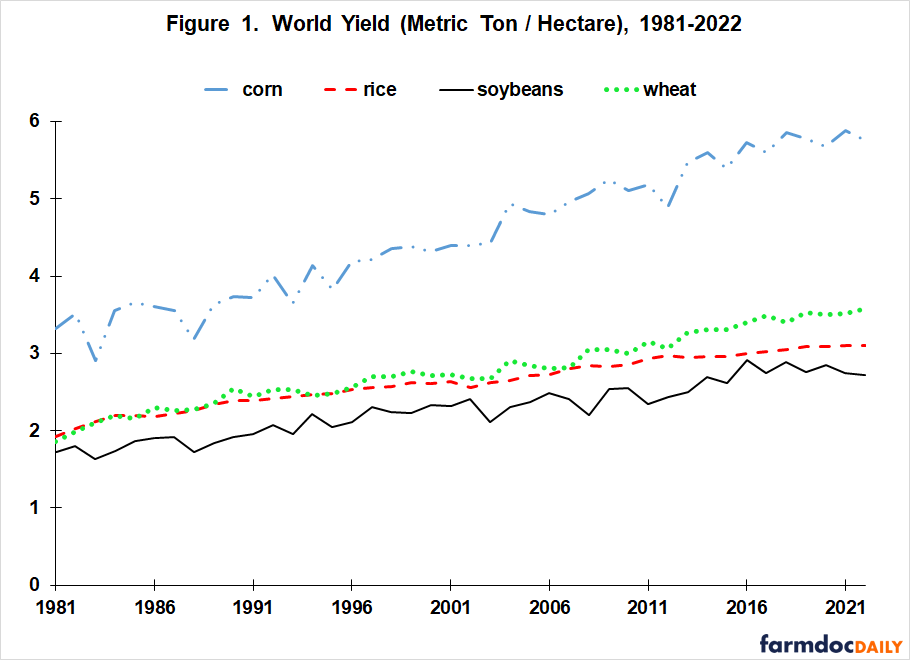
World corn, rice, soybean, and wheat yields trended higher over the 1981-2022 analysis period (see Figure 1). Trend yield for corn, soybeans, and wheat increased respectively at a constant annual rate of +0.068, +0.028, and +0.037 metric tons per hectare per year. R2s of the linear trend models were 96% (corn), 91% (soybeans), and 97% (wheat). The increase in world rice yield has declined slightly in recent years. For 2021 and 2022, the rate of growth was +0.0183 and +0.0179 metric tons per hectare, respectively. R2 for rice’s linear plus squared time trend model was 99%. As a group, the world yield series do not suggest a slowing in aggregate yield growth.
Regional Yield Trends
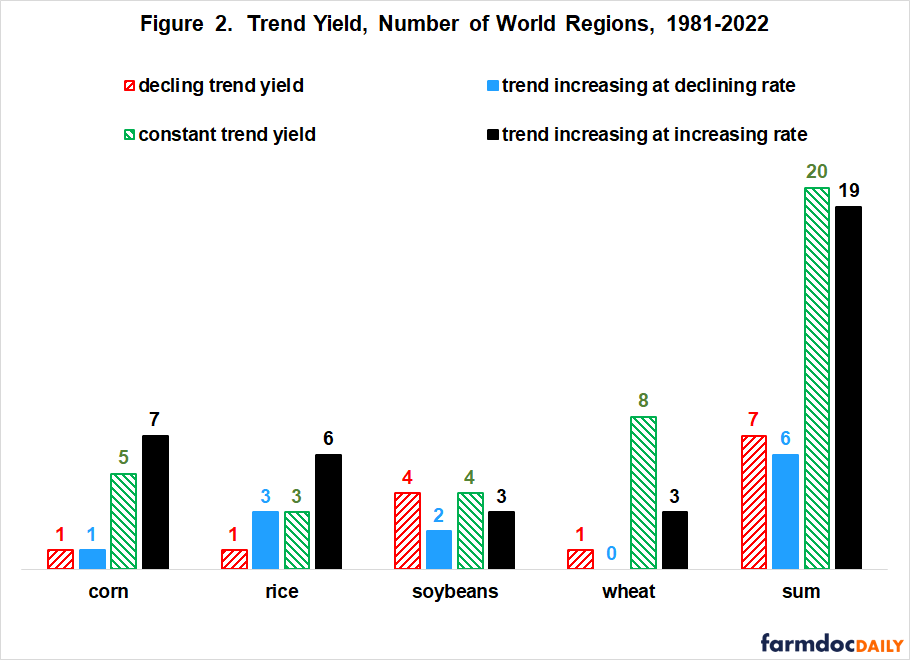
Findings were grouped into four categories. Of the 52 region/crop combinations which had yields available for all years, 39 or 77% had a trend yield that increased at a constant rate throughout 1981-2022 or, in recent years, increased at an increasing rate (see Figure 2). Trend yield was declining for 14% of the crop/region combinations, while it was increasing at a slower rate in recent years for 13% of the combinations. Wheat and corn had the fewest regions, while soybeans had the most regions in the declining yield plus slowing rate of increase categories.
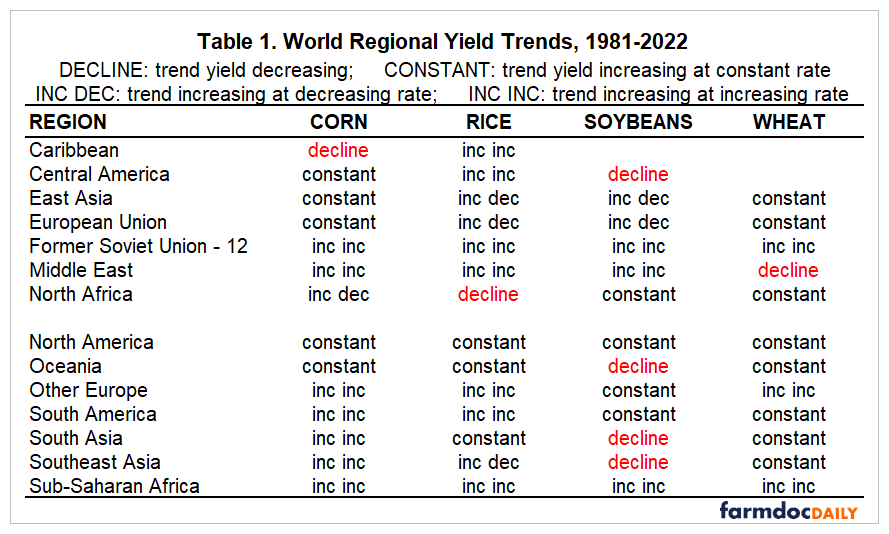
Reinforcing the findings discussed in the previous paragraph, no region had more than one crop whose trend yield was declining (see Table 1). Only two regions had two crops whose yield was declining or increasing at a slowing rate. These crop/region combinations are corn and rice in North Africa and rice and soybeans in Southeast Asia.
Discussion
Overall, the weight of the evidence from the above analysis does not suggest that the trend increases in the world or larger regional yields have slowed. Most agree that the climate has been changing over the period of this analysis, probably at an increasing rate.
Research suggests climate change has already negatively impacted conditions for crop production at more micro-scales (i.e. country and sub-country levels). However, data on world and larger regional crop yields suggests farmers and agriculture have thus far been able to adapt. This adaptation might include regional shifts in crop acreage and other management adjustments.
This analysis does not address the impact of climate change on smaller geographical areas, such as individual countries. However, for smaller areas, the effect of climate change at regional and world levels matters if trade in agricultural products is free. Negative impacts of climate change on production in one area can be mitigated by increased imports from the same or nearby regions. The role of free trade in managing the impacts of climate change on agricultural production has generally received little attention in national and international discussions. It is important to include it.
A recent, non-climate illustration of world grain and oilseed adaptability is the increase in world production since the Ukraine-Russia War began (see farmdoc daily, November 27, 2023). While many have concerns about future agricultural productivity, aggregate trends in yield growth do not support that climate change has impacted productivity up to this point at the world and regional levels. Another impact of climate change may be more variable world and regional yields. That impact will be analyzed in a future farmdoc daily article.
Data Note 1: For an accessible, extensive discussion of the various definition and measurement issues surrounding the concept of sustainability see the entry in Wikipedia. A common element in the various definitions of sustainability is the idea of meeting current needs without compromising the ability to meet future needs.
References and Data Sources
US Department of Agriculture, Foreign Agriculture Service. August 2023. Production, Supply, and Distribution Online. https://apps.fas.usda.gov/psdonline/
Wikipedia. December 2023. Sustainability. https://en.wikipedia.org/wiki/Sustainability
Zulauf, C., N. Paulson, G. Schnitkey and J. Colussi. “Resiliency in World Grain and Oilseed Production and the Ukraine-Russia War.” farmdoc daily (13):214, Department of Agricultural and Consumer Economics, University of Illinois at Urbana-Champaign, November 27, 2023.
Disclaimer: We request all readers, electronic media and others follow our citation guidelines when re-posting articles from farmdoc daily. Guidelines are available here. The farmdoc daily website falls under University of Illinois copyright and intellectual property rights. For a detailed statement, please see the University of Illinois Copyright Information and Policies here.


