


Post-harvest Grain Marketing: Do Farmers Reap the Benefits?
Better prices are the primary motive for farmers to store and market grain after harvest. However, realizing higher prices for post-harvest delivery than those offered for delivery at harvest or ‘off the combine’ is no given. In earlier articles (farmdoc daily, December 8, 2023; December 15, 2023), I described the post-harvest marketing challenge and quantified how much of Illinois corn and soybean production remains to be marketed after harvest. Roughly 60% of corn and soybeans produced in Illinois remain to be sold at the end of the calendar year, but this aggregate number hides much variation across farmers. Many farms have essentially all of one year’s production in inventory at calendar year end.
The extent to which unsold production presents a price risk management problem for the farm depends on how big and how variable are the possible post-harvest marketing gains: the difference between the price the farm receives for post-harvest sales less what they could have received by selling at harvest. While we expect marketing gains to be positive because of typical seasonal price appreciation, nothing ensures this is so. Moreover, farms can use a wide range of marketing contracts to make sales both pre- and post-harvest, so determining the ‘correct’ pre- and post-harvest comparison is difficult.
In this article, I examine the post-harvest marketing performance of farms in the Illinois Farm Business Farm Management Association. I consider the distribution of marketing gains by comparing the price a farm receives post-harvest to the price received for near-to-harvest sales by the same farm in the same marketing year. This eliminates the confounding influence of location, marketing skill, and other farm-specific factors affecting marketing performance.
I find farms realize gross returns to post-harvest marketing that are on average roughly consistent with typical seasonal cash price increases. Farmers who realize sales after January 1 receive prices that are on average consistent with the typical increase in price following the near-to-harvest period. However, the range of realized outcomes is large and negative returns are common. On a risk-adjusted basis, the returns to post-harvest marketing appear to be small.
Corn and Soybean Price Seasonality
Higher prices later in the marketing year, the typical seasonal price pattern, provides incentive for farm managers and other decision makers in the grain supply chain to store grain and make sales for post-harvest delivery. Figure 1 illustrates the seasonal pattern for corn and soybeans using USDA Agricultural Marketing Service cash market price data for Central Illinois from the 2004-05 to 2019-20 marketing years. Note the marketing year for corn and soybeans runs from September 1 to August 31 of the following calendar year.
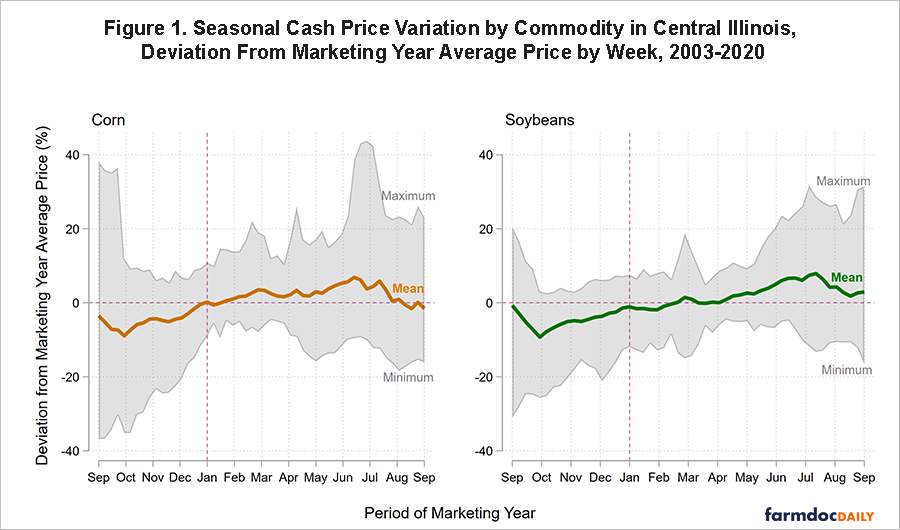
Values shown in Figure 1 are deviations in a given week from the simple marketing year average price which is the unweighted mean of daily price observations from that marketing year. These deviations remove differences in price levels across marketing years to focus on seasonal price changes within each year.
I use the mean price series to represent the typical seasonal price pattern and a baseline marketing gain. The mean price series is average difference between the price in a given week and the marketing year average price. The mean price series shows both corn and soybean prices hit seasonal lows at the beginning of October. The mean weekly deviation from the season average price (the thick line in Figure 1) is lowest at this point, coinciding with the typical harvest period in Central Illinois. Seasonal highs occur in the months of June and July. Prices tend to rise steadily between October and June.
The mean price pattern in Figure 1 shows both corn and soybean prices appreciate about 20 percent between the seasonal low and high. Comparing the September to December, near-to-harvest period to the later post-January 1 period (delineated by the vertical line in Figure 1), typical price appreciation is about 6-7%. However, the extreme values illustrated in Figure 1 show there may be substantial differences in any given year between observed prices and the typical seasonal pattern.
Farmers and other grain sellers have other strategies to realize post-harvest marketing gains. Futures and forward contract markets often exhibit ‘carry’ where the prices for deferred delivery exceed nearby prices. By selling forward for later delivery, i.e., selling the carry, farmers may both realize marketing gains and mitigate price risk. The ability to forward contract dramatically increases the marketing options available to farmers and the possible range of marketing outcomes.
It is difficult to define a benchmark return for post-harvest grain marketing in the presence of forward contracts like the typical cash price appreciation shown in Figure 1. For example, the harvest-time cash price may no longer be the relevant baseline price if farmers harvest-time sales are realized against pre-harvest grain sales. Some evidence suggests pre-harvest sales can realize a weather risk premium relative to the prevailing price at harvest (farmdoc daily June 2, 2021).
Typical carry as of Dec 1, Nov 1. Show average plus greyed out carry patterns for all years. mid December. (January 1)
Actual Marketing Returns
To assess marketing performance and evaluate the range of possible marketing gains, I consider realized sales prices in both the near-to-harvest and post-harvest periods. Rather than measure marketing performance against an assumed marketing strategy, such as comparing actual sales prices to observed prices for cash sales at harvest, I consider realized marketing performance by comparing the realized price for post-harvest sales to the price received for sales realized near-to-harvest. This comparison is farm-specific and so it adjusts for the possible influence of location, marketing skill, and other farm-specific factors that affect marketing performance but do not vary over time.
I assemble data on annual inventory and production quantities for corn and soybeans for roughly 16,000 farm-year observations from FBFM between 2003 and 2020. Observing calendar year sales quantity and value alone would be insufficient to evaluate post-harvest marketing performance because the average sales price includes sales of both old-crop inventory and new-crop production. However, Illinois FBFM also records the quantity and value of what it calls old-crop and new-crop sales. New-crop sales are sales of current calendar year production realized prior to the end of the calendar year. I call these near-to-harvest sales. Near-to-harvest sales are realized in the sense that delivery is made and revenues received before January 1. Commodities held in on-farm storage and unsold, those delivered into commercial storage where ownership is retained, and those held in any location but forward contracted for delivery and transfer of ownership on or after January 1 are old-crop sales for the next calendar year. I refer to these old-crop sales as deferred sales.
I measure the gross return to post-harvest marketing as the percentage difference between deferred and near-to-harvest sales. This is a gross return in that it excludes any costs associated with post-harvest marketing, including the physical and opportunity/interest costs of holding inventories. Considering percentage differences permits comparisons across marketing years with different price levels.
Figure 2 shows the distribution of gross returns across the entire 2003/04 to 2019/20 marketing year period. The figure shows both positive and negative returns are possible. Realized gross returns range from about -40% to +50%. The most prevalent outcomes are near-zero returns. The small colored bars along the horizontal axis indicate the average return across all years. Average gross returns are roughly 7% for corn and 6% for soybeans. These values are very similar to the average seasonal cash price appreciation between the pre-January 1 and post-January portions of the marketing year shown in Figure 1.
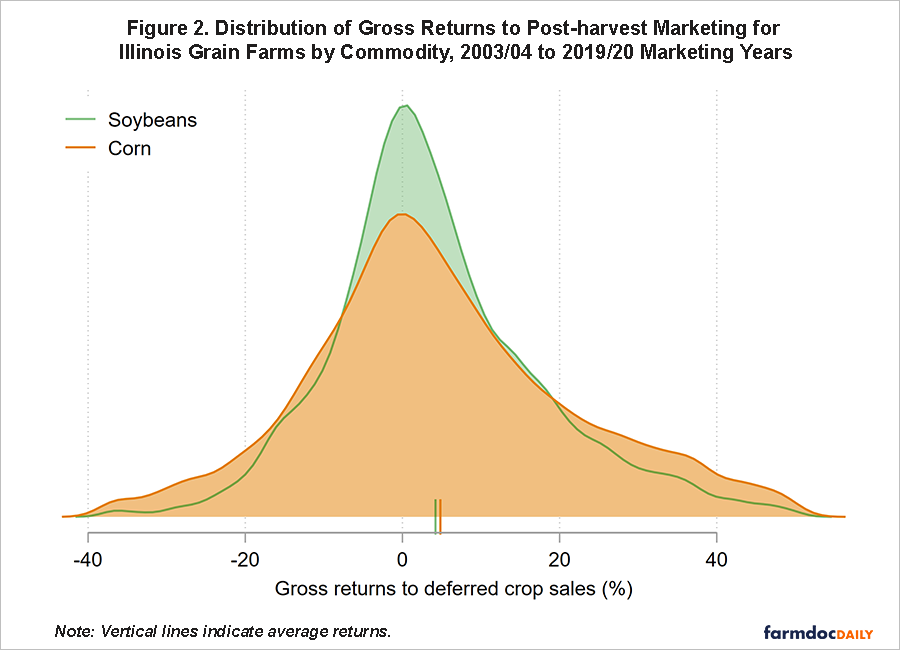
Though the distribution of marketing outcomes in Figure 2 is informative about the possible returns to post-harvest grain marketing, there are some notable caveats. First, the distribution pools outcomes across a wide set of years and market conditions. In some years, most farms realize significant, positive returns. In other years, the opposite is true. Perhaps a better measure of the potential variability in outcomes would be the year-specific variation across farms. Future articles on post-harvest grain marketing
Second, the distribution does not represent all farms. Because returns can only be calculated for farms with both near-to-harvest and deferred, post-harvest sales, it excludes those farms that do not make near-to-harvest sales. This condition is common; the distribution excludes roughly 40% of farms. Assessing their marketing performance is more difficult and likely must rely on comparison to assumed benchmark prices.
Implications
The realized post-harvest marketing performance described in this article offers at least three useful insights on farm-level grain marketing:
- Average gross returns are positive. We should anticipate farms who maximize expected future profits to hold inventories and market grain post-harvest.
- Gross returns are subject to substantial risk. Assuming variation across farms is an indicative measure of the risk of future post-harvest marketing activity, the risk-adjusted returns appear to be small. Farms are not making post-harvest sales only when they observe positive returns from forward contracting post-harvest sales (i.e., selling the carry).
- Actual prices received from pre-harvest sales for delivery near-to-harvest may be better than typical price benchmarks used to evaluate post-harvest sales such as the harvest-time cash price. One source of negative returns in this case is successful marketing activity in the pre-harvest period.
This analysis suggests farmers should carefully weigh the risks of post-harvest grain sales, especially unhedged sales. Although farmers do realize profits in the aggregate from selling later, the wide variety of outcomes from deferred sales shows the downside risk of losing money on stored grain is significant. Farmers can manage this risk and secure gains from deferred sales through forward contracting. Seasonal price appreciation is real but cannot be realized with certainty unless farmers use forward contracts to secure those gains.
Acknowledgment
The author would like to acknowledge that data used in this study comes from the Illinois Farm Business Farm Management (FBFM) Association. Without Illinois FBFM, information as comprehensive and accurate as this would not be available for educational purposes. FBFM, which consists of 5,000+ farmers and 70 professional field staff, is a not-for-profit organization available to all farm operators in Illinois. FBFM field staff provide on-farm counsel along with recordkeeping, farm financial management, business entity planning and income tax management. For more information, please contact the FBFM office located on the campus of the University of Illinois in the Department of Agricultural and Consumer Economics at 217-333-8346 or visit the FBFM website at www.fbfm.org.
References
Janzen, J. "Post-harvest Grain Marketing: Store and Ignore Versus Market Responsive Farms." farmdoc daily (13):228, Department of Agricultural and Consumer Economics, University of Illinois at Urbana-Champaign, December 15, 2023.
Janzen, J. "Post-Harvest Grain Marketing: How Important Is It?" farmdoc daily (13):223, Department of Agricultural and Consumer Economics, University of Illinois at Urbana-Champaign, December 8, 2023.
Janzen, J. "The Weather Risk Premium in New-Crop Corn Futures Prices." farmdoc daily (11):88, Department of Agricultural and Consumer Economics, University of Illinois at Urbana-Champaign, June 2, 2021.
Disclaimer: We request all readers, electronic media and others follow our citation guidelines when re-posting articles from farmdoc daily. Guidelines are available here. The farmdoc daily website falls under University of Illinois copyright and intellectual property rights. For a detailed statement, please see the University of Illinois Copyright Information and Policies here.