The Contributions of Government Transfer Payments to Personal Income
Contributions to personal income vary widely. Many working-age Americans rely heavily on the income earned from wage and salary jobs, whereas rental incomes or investment dividends comprise a greater share of income for wealthier individuals. Other Americans—particularly many older Americans—rely more on government transfer payments. Government transfer payments to individuals include benefits related to retirement and disability insurance (e.g., Social Security), medical benefits (e.g., Medicare and Medicaid), as well as income maintenance benefits, unemployment insurance compensation, and veterans’ benefits, among others.[1]
These income sources are critical for both individuals and communities. For many older, disabled, and/or disadvantaged individuals, government transfer payments provide them with resources they need to meet their basic healthcare and income needs. For rural communities, these government transfers are often spent locally and can ensure the viability of local grocery stores or healthcare providers. Last November, the U.S. Bureau of Economic Analysis (BEA) released 2022 Local Area Personal Income data.[2] This article uses these data to show how government transfer payments contribute to individual personal income, and how these payments are geographically distributed across metropolitan and nonmetropolitan areas of the country.
Older Americans Receive the Majority of Government Transfers to Individuals
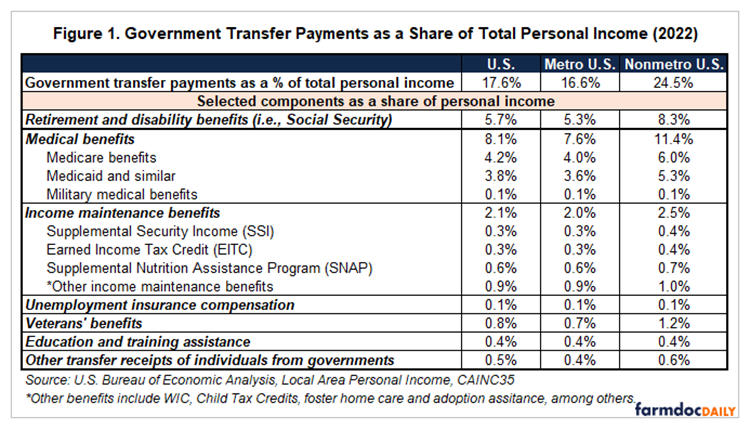
Figure 1 shows that in 2022, government transfer payments represented 17.6%—or almost $1 out of every $6—of the nation’s total personal income. The states where government transfer payments contributed the greatest relative share of personal income included West Virginia (28.9%), New Mexico (26.5%), Mississippi (25.8%), Kentucky (24.8%), and Louisiana (23.9%). The states where transfer payments accounted for the lowest relative share of total personal income were Utah (12.7%), Colorado (13.2%), the District of Columbia (13.8%), North Dakota (14.1%), and Washington (14.2%).
Among all sources of government transfers, medical benefits (8.1% of total personal income) and retirement and disability benefits (5.7%) make the greatest contributions to personal income.[3] The largest programs within each of these categories—Medicare and Social Security—primarily benefit older Americans. Public assistance medical benefits (i.e., Medicaid) is another notable source of government transfer payments. According to the Population Reference Bureau (Lee and Jarosz, 2017), almost half of Medicaid participants are children and another 13 percent are disabled individuals aged 19 to 64. Medicaid also benefits older Americans, as over 10 percent of participants are lower income adults aged 65 and older, who receive Medicaid benefits to supplement Medicare.
Income maintenance benefits accounted for a combined 2.1% of total U.S. personal income in 2022. Individually, these programs represent a relatively small share of total personal income. For instance, SNAP (i.e., food stamps) benefits are only 0.6% of total U.S. personal income, while Supplemental Security Income (benefits received by low-income persons who are aged, blind, or disabled) and Earned Income Tax Credits are each 0.3%. Other notable transfer payments result from veterans’ benefits (0.8%) and education and training assistance (0.4%). Unemployment insurance compensation represented just 0.1% of total government transfer payments in 2022, but this share increases during economic downturns. For instance, unemployment insurance compensation rose to 2.7% and 1.5% of total personal income in 2020 and 2021, respectively, as a result of the pandemic-induced recession.
Rural Areas Rely More on Government Transfers Than Urban Areas
Figure 1 also shows the contributions that government transfer payments make to personal income in metropolitan and nonmetropolitan counties.[4] Government transfers represent almost $1 out of every $4 of total personal income in nonmetro (i.e., rural) U.S. counties. Nonmetro counties often have older populations, and therefore a greater share of residents receives Social Security and Medicare. Many rural counties also have relatively lower per capita incomes than more urban counties. As a result, a greater share of their residents is also more likely to receive Medicaid, and to a lesser extent, income maintenance benefits. This is not to say that more urban counties do not have need, but in aggregate, rural counties are more reliant on government transfers than metropolitan counties.
Figure 2 shows government transfers as a percent of total personal income for U.S. counties. Government transfers account for the largest relative share of personal income in the nation’s most disadvantaged regions (e.g., Appalachia, the Ozarks in Missouri and Arkansas, the Mississippi Delta region, tribal areas in the southwest). In 24 counties, government transfers represent more than 50% of total personal income; 18 of these counties are in Eastern Kentucky or Southern West Virginia. These areas have older and more impoverished populations, so these trends reflect both regional demographics and regional needs.
Among larger metro counties (those with populations greater than 500K), government transfers contributed over a quarter of personal income in Pima County, AZ (i.e., Tucson) and Fresno County, CA (i.e., Fresno). Government transfers also comprise a sizable share of total personal income in other large counties in California’s Central Valley and Southern California. Veterans’ benefits and military health benefits are unevenly distributed across the country but are highest in counties with a large military footprint. In 2022, Veterans’ benefits contributed more than 7% of total personal income in North Carolina’s Cumberland and Hoke counties (Fort Liberty, formerly Fort Bragg), Georgia’s Liberty and Long counties (Fort Stewart), and Coryell County in Texas (Fort Cavazos, formerly Fort Hood).
The Aging Population and Persistent Need Makes Government Transfers an Important Source of Personal Income for Many Americans
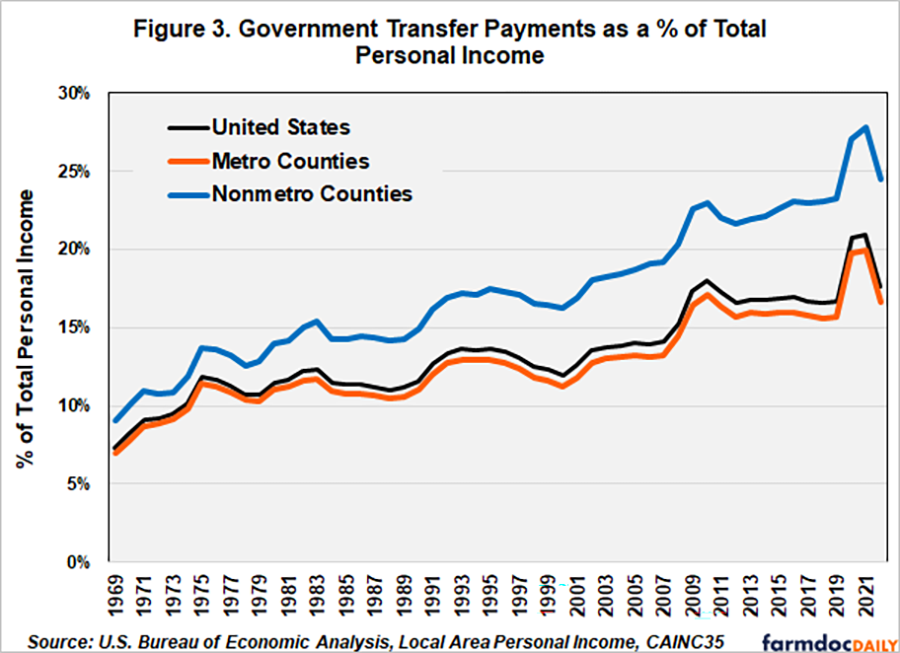
The relative share of government transfers to personal income has increased over the past 50 years, growing from 7.3% in 1969 to 17.6% in 2022 (Figure 3). These shares have also had notable increases during periods of economic stress; for example, they surpassed 20% in 2020 and 2021. Some of these increases can be attributed to an aging population that is generally living longer than previous generations and therefore the need for retirement and medical benefits has grown. That said, there are significant health inequalities and life expectancies between different U.S. states and region and in some—often rural—regions, life expectancy has declined (Karas Montez, et. al, 2020).
Over the course of the past 50 years, the nation’s most rural counties have relied more on government transfer payments than more metro counties.[5] In spite of the significant progress made by organizations like the Appalachian Regional Commission (Poole, et al., 2015) and the Mississippi Delta Authority (Pender and Reeder, 2011) to address regional challenges, these regions continue to grapple with persistent, entrenched poverty. In other regions, persistent and widening income inequality has further expanded the reliance on government transfers. Consequently, programs like Medicaid and SNAP continue to help many families, particularly in disadvantaged regions across the country, meet their most basic needs.
Notes
[1] These are payments to individuals and do not include government payments to business enterprises (e.g., farm subsidies).
[2] These data are drawn from U.S. BEA’s Regional Accounts, and specifically Table CAINC35: Personal Current Transfer Receipts. The article focuses most on “Current transfer receipts of individuals from governments”, which defined by U.S. BEA consists of retirement and disability insurance benefits, medical benefits, income maintenance benefits, unemployment insurance compensation, veterans’ benefits, education and training assistance, and other transfer receipts of individuals from governments.
[3] Social Security accounts for 97% of all retirement and disability benefits.
[4] Metropolitan Statistical Areas (MSAs) are defined by the U.S. Office of Management and Budget and are based on the size of urbanized areas in a central county; surrounding counties are included based on their economic integration (as defined by commuting levels) with the core county. The MSA definitions used here are based on the 2023 delineation files provided by the U.S. Census Bureau. U.S. BEA provided data for the metropolitan and nonmetropolitan portions of the U.S. and U.S. states, although those definitions are based on 2020 delineation files. Here, we use rural to refer to non-metropolitan counties.
[5] These data use the 2023 metro definitions. Over the past half century time, many nonmetro counties have grown and ultimately become metro counties. That said, the current nonmetro counties have been consistently more rural over this period.
References
Karas Montez, J., Beckfield, J., Kemp Cooney, J., Grumbach, J., Hayward, M., Zeyd Koytak, H., Woolf, S., and Zajacova, A. (2020). “U.S. State Policies, Politics, and Life Expectancy,” The Milbank Quarterly 98(3): 668-99.
Lee, A. and Jarosz, E. (2017). ‘Majority of People Covered by Medicaid and Similar Programs Are Children, Older Adults, or Disabled’, Washington, D.C.: Population Reference Bureau.
Pender, J. and Reeder, R. (2011). ‘Impacts of Regional Approaches to Rural Development: Initial Evidence on the Delta Regional Authority’, ERR-119, Washington, D.C.: U.S. Department of Agriculture, Economic Research.
Poole, K., Romitti, M., White, M., Feser, E., Mix, T., Jackson, R., Lacombe, D., Piras, G., Sayago-Gomez, JT, Deskins, J. and Ruseski, J. (2015). ‘Appalachia Then and Now: Examining Changes to the Appalachia Region since 1965’. Washington, D.C.: Appalachian Regional Commission.
Disclaimer: We request all readers, electronic media and others follow our citation guidelines when re-posting articles from farmdoc daily. Guidelines are available here. The farmdoc daily website falls under University of Illinois copyright and intellectual property rights. For a detailed statement, please see the University of Illinois Copyright Information and Policies here.


