


US Farm Liquid Assets, Self-Insurance, and Financial Resiliency
This article examines liquid assets on US farms since 1960. Liquid assets serve multiple purposes. They include self-insurance to meet unexpected farm and farm household expenses and to cushion fiscal impacts of poor farm production, as well as to provide flexibility to take advantage of business and other opportunities. Liquid assets held by US farms have increased over time and now exceeds $300 billion. However, they have not increased as much as cash production expenses, implying that their self-insurance role in providing financial resiliency to produce next year has declined. Some of the decline overlaps with publically-subsidized US farm commodity insurance, prompting a policy question of whether public subsidies have replaced private self-insurance. Concurrent data trends suggest the research hypotheses that the US farm commodity insurance program has allowed farmers to reduce liquid assets that provide self-insurance but increased financial resiliency (insured liability plus self-insurance) and provided farmers collectively an additional source of income.
Data Source
Liquid assets are defined in this article as the value of financial assets excluding farm operator dwellings plus the value of inventories of crops, livestock and poultry, and purchased farm inputs. The latter includes both prepaid production inputs and the value of inputs invested in growing crops. Crop, livestock, and poultry inventory can be sold relatively easily should a need for cash arise. Inputs already purchased reduce the need for future cash.
Values of each of the four liquid assets are available as of December 31 from the farm income and wealth data set maintained by USDA, ERS (US Department of Agriculture, Economic Agency). Data start in 1939 for crop inventory, 1960 for financial assets and livestock and poultry inventory, and 1984 for purchased inputs. Starting date for the analysis was set at 1960.
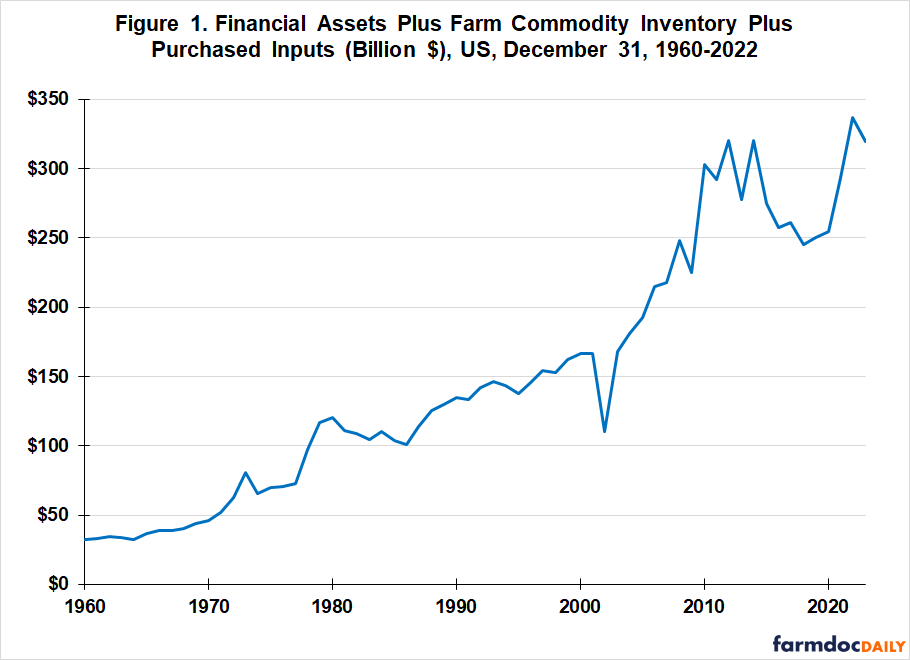
Liquid Assets
The sum of the four liquid assets persistently increased from $32 billion in 1960 to $192 billion in 2005 (see Figure 1). They then increased roughly 50% between 2005 and 2010, but since have fluctuated around $300 billion. (See Data Note.)
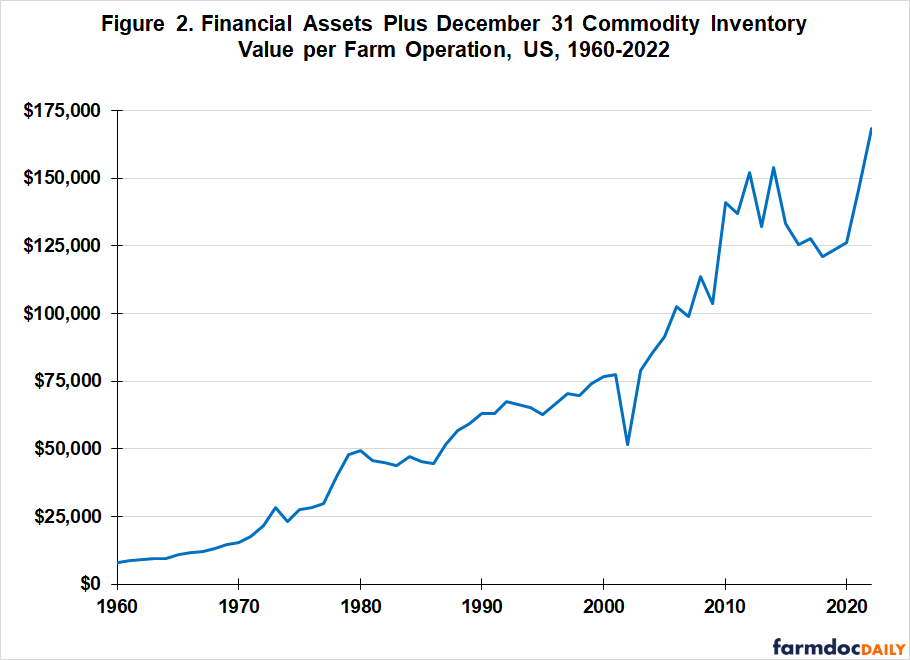
Liquid Assets per Farm Operation
The decline in number of farm operations from 4.0 million in 1960 to 2.1 million in 2005 combined with the increase in total liquid assets (see Figure 1) to result in an 11 times increase in liquid asset per farm: from $8,076 (1960) to $91,677 (2005) (see Figure 2). Since 2005, farm operations have stabilized, numbering 2.0 million in 2022. As a result, changes in total assets and liquid assets per farm have mirrored one another since 2005.
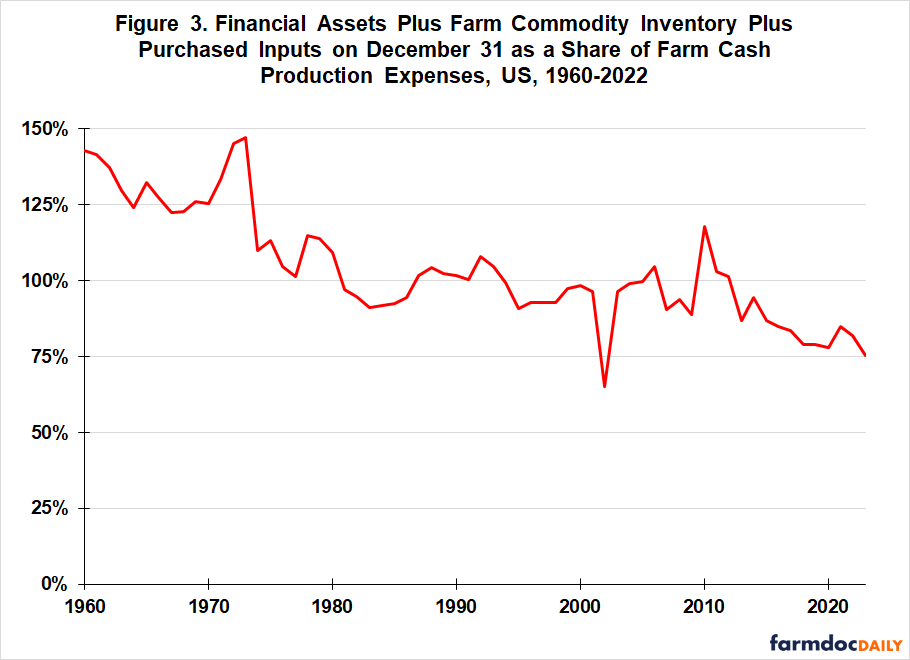
Liquid Assets Relative to Cash Production Expenses
A different perspective emerges if liquid assets are expressed relative to farm cash production expenses excluding operator dwellings. This ratio has declined by nearly half since 1960: from 143% to 75% (see Figure 3). The decline has not been consistent, but concentrated in the mid-to-late 1970s and post 2010.
Liquid Asset Type Relative to Cash Production Expenses
Between 1960 and 2022, the ratio to farm cash expenses declined by -16 percentage points (pp) for financial assets (29% – 45%) and crop inventory (12% – 28%), and -40 pp for livestock and poultry inventory (30% – 70%) (see Figure 4). The ratio for purchased inputs has fluctuated around 6% since the early 2000s, with a high of 8% in 2010.
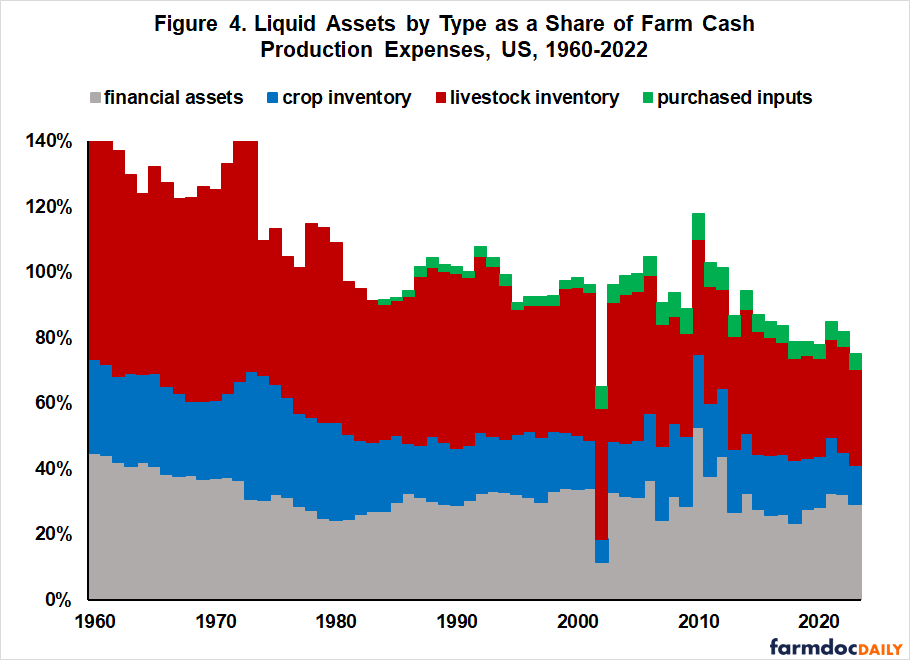
The decline in financial assets as a share of farm cash production expenses occurred between 1960 and 1975. Its ratio has since fluctuated around 30%. The decline in the crop inventory ratio occurred between the late 1970s and late 1980s. During this period, the US accumulated large public stocks, including the farmer-owned reserve that paid farmers a monthly subsidy to store crops. Congress decided in the 1985 farm bill to reduce the role of public stocks, including the farmer-owned reserve; in part due to their cost. Since 1990, farmer inventory of crops has fluctuated mostly within a range of 15% to 25% of farm cash production expenses.
The decline in livestock and poultry inventory relative to farm cash production expenses has been gradual, averaging -0.6 pp per year. Since 2002, USDA, ERS has reported breeding and non-breeding livestock and poultry inventory. Over this period, breeding stock has accounted for most of the decline. Its share declined -9 pp (19% – 28%) vs. -2 pp for non-breeding stock (10% – 12%). The decline in breeding stock share likely reflects in part the increased efficiency in livestock production as measured by pounds of output produced per breeding animal (see farmdoc daily, May 24, 2019).
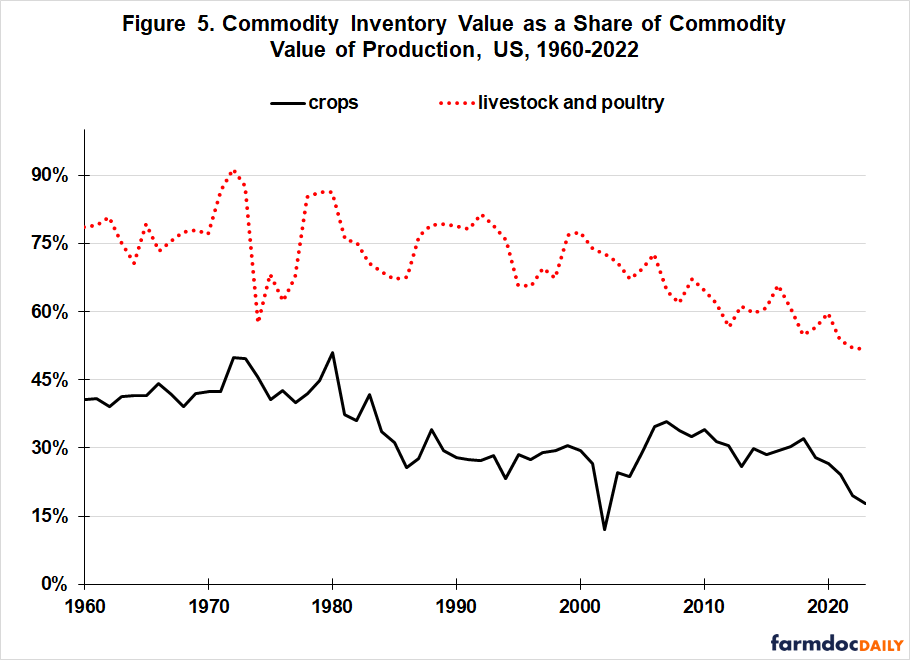
It would be desirable to examine crop and livestock and poultry inventory as a share of their own cash production expenses. Such a breakout of expenses is not available, but inventory value relative to value of production can be calculated. The crop ratio has declined -23 pp (18% – 41%) while the livestock-poultry ratio has declined -27 pp (52% – 79%) (see Figure 5). These ratios suggest that similar declines have occurred in the role of commodity inventory as a cash flow buffer for the US crop and US animal sectors.
Discussion
Among their uses, liquid assets provide self-insurance and thus resiliency that production will continue next year. In this analysis, liquid assets are defined as farm financial assets excluding operator dwellings plus the value of crop, livestock and poultry, and purchased input inventories.
Liquid farm assets have increased over time, but not by as much as farm cash production expenses. The ratio of liquid farm assets to farm cash production expenses has declined by almost 50%, implying a decline in self-insurance. The decline was concentrated in the mid and late 1970s and post 2010.
A policy question is, “Has publically-subsidized insurance substituted for private self-insurance?” Causation is difficult to establish, but part of the decline in private self-insurance overlaps with the growth in publically-subsidized farm insurance that dates to the Federal Crop Insurance Act of 1980.
To put this question in context, US farms would need an additional $144 billion in liquid assets, or $72,000 per farm operation for the ratio of liquid farm assets to farm cash production expenses in 2023 to be the same as in 1980. For the 2023 commodity year, US farms paid $5.4 billion in premiums to buy $208 billion in insured liability from the US farm commodity insurance program. However, due to public subsidies, US farms received on average $6.6 billion more per year over 2018-2022 in indemnities than the premiums they paid.
The data in the preceding bullet point suggest the research hypotheses that the Federal farm commodity insurance program has allowed farmer to reduce liquid assets that provide self-insurance while increasing resiliency (insured liability plus self-insurance) and providing farmers collectively an additional source of income.
A follow-on policy question is “How have US farmers used funds freed by the reduction in self-insurance?” Specifically, “Have they been used to increase farm production efficiency or been bid into the price of non-liquid assets such as machinery, buildings, and land?” Which of these two responses has dominated requires additional analysis. US society has largely benefited if the answer is found to be the former. If the answer is found to be the latter, farmers and farm lenders have largely benefited via increased wealth and fewer farm bankruptcies.
Data Note
It would be desirable to subtract debt to be paid in the next year from liquid assets. USDA, ERS began reporting current debt (liabilities owed to lenders within 12 months) for 2009. It has varied from $74 billion (2009) to $98 billion (2016 and 2017). As a ratio to liquid assets as defined in this article, they have varied from 25% (2012) to 40% (2018).
References
US Department of Agriculture, Economic Research Service. January 2024. Farm Income and Wealth Data. https://www.ers.usda.gov/data-products/farm-income-and-wealth-statistics/
US Department of Agriculture, Risk Management Agency. Summary of Business. January 2024. https://www.rma.usda.gov/en/Information-Tools/Summary-of-Business
Zulauf, C. "Comparing Livestock Productivity Since 1993." farmdoc daily (9):96, Department of Agricultural and Consumer Economics, University of Illinois at Urbana-Champaign, May 24, 2019.
Disclaimer: We request all readers, electronic media and others follow our citation guidelines when re-posting articles from farmdoc daily. Guidelines are available here. The farmdoc daily website falls under University of Illinois copyright and intellectual property rights. For a detailed statement, please see the University of Illinois Copyright Information and Policies here.