


Do Different Types of Farms Pay Different Interest Rates?
Related Podcast: Navigating Farm Loan Interest Rates (Apr ’24)
Agricultural operations are facing unique financing challenges due to elevated input and farmland prices combined with a multidecade high in interest rates. Elevated production expenses increase the need for borrowing, and high interest rates impact farms through increased borrowing costs. Traditionally, a large share of non-real estate debt held on farm balance sheets has been current[1] debt, which is sensitive to shifts in interest rates. However, longer-term debt can be vulnerable as well. The Kansas City Federal Reserve reports half of all farmland real estate loans will need to be refinanced in the next 18 months (Kreitman 2024). In this final article of our series, we examine how the interest rates charged by various lenders differ by farm commodity specialization and farm business typology.
For our analysis, we used 2022 data from USDA’s Agricultural Resource Management Survey (ARMS). ARMS is a nationally representative survey of farm operations that includes questions on outstanding farm debt (including interest rate information). We grouped the data by farm commodity specialization[2] (i.e., whether the respondent was a crop or livestock operation) and farm business typology[3] (i.e., whether the operation was a rural residence, intermediate, or commercial farm). Then, we calculated median rates[4] on newly originated short-term non-real estate, long-term non-real estate (hereafter, intermediate debt), and real estate debt issued by Farm Credit System (FCS) lenders, commercial banks (hereafter banks), and vendors[5]. We report medians rather than means to lessen the influence of outliers. For each debt type and lender, we test[6] whether interest rates are statistically different across farm types and lender groups.
Do Crop or Livestock Operations Pay Higher Rates?
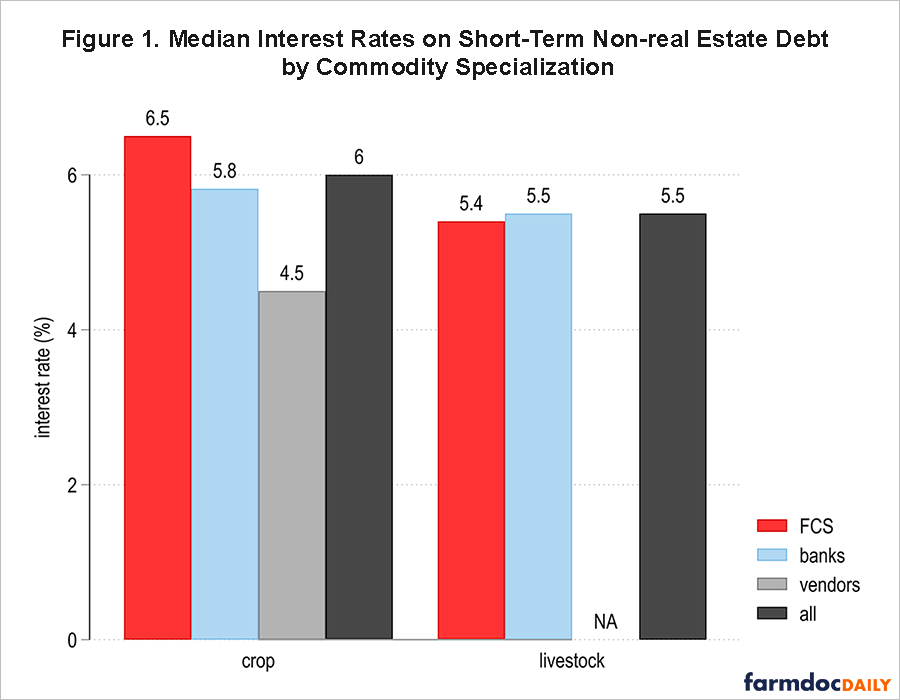
Median interest rates on 2022 short-term, intermediate, and real estate debt for crop and livestock operations are shown in Figure 1, Figure 2, and Figure 3, respectively. For short-term debt across all lenders, crop farms paid rates that were 50 basis points higher than livestock farm rates. However, the rates are not statistically different. Additionally, though median interest rates varied by lender and farm specialization, none of the individual lender types (i.e., banks, FCS lenders, and vendors) charged statistically different rates to crop operations relative to livestock operations. For example, interest rates on short-term bank loans were not statistically different between crop and livestock farms. Median FCS lender rates were 6.5% for crop producers and 5.4% for livestock producers; median bank rates were 5.8% for crop producers and 5.5% for livestock producers.
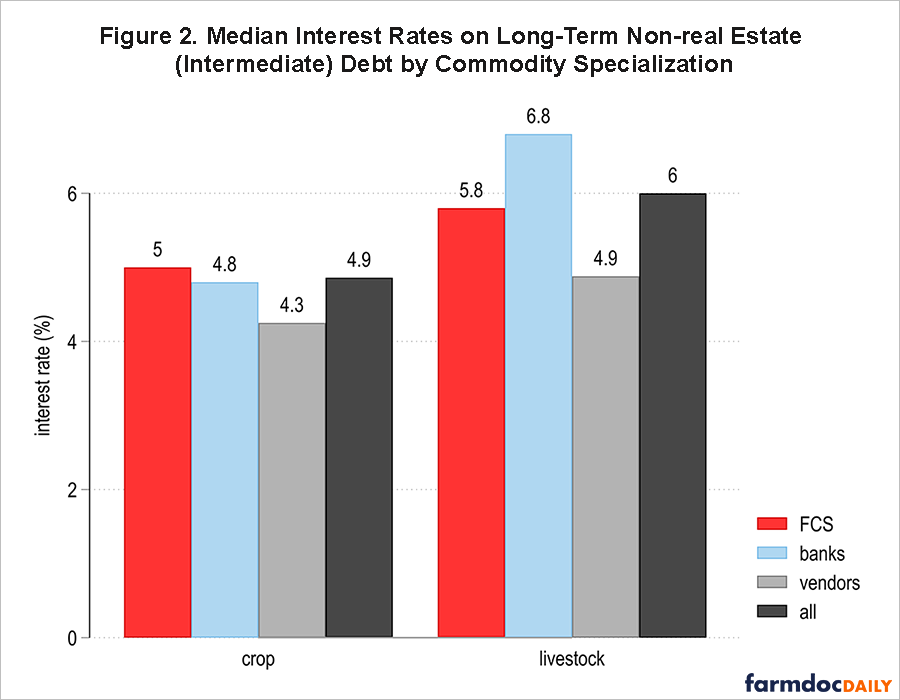
We see an opposite trend for intermediate debt as crop operations tended to pay lower rates than their livestock counterparts; across all lenders, the median rate was 4.9% for crop operations and 6% for livestock operations. The difference in rates between crop and livestock operations was 60 basis points on debt issued by vendors and 200 basis points on debt issued by banks. By lender type, rates charged on intermediate debt were not statistically different for crop farms. However, bank rates that livestock farms paid on intermediate loans were higher (6.8%) and statistically different from rates charged by FCS lenders (5.8%) and vendors (4.9%). These differences may reflect how crop and livestock farms use intermediate debt to finance livestock and machinery purchases and the risks and financing costs associated with these purchases.
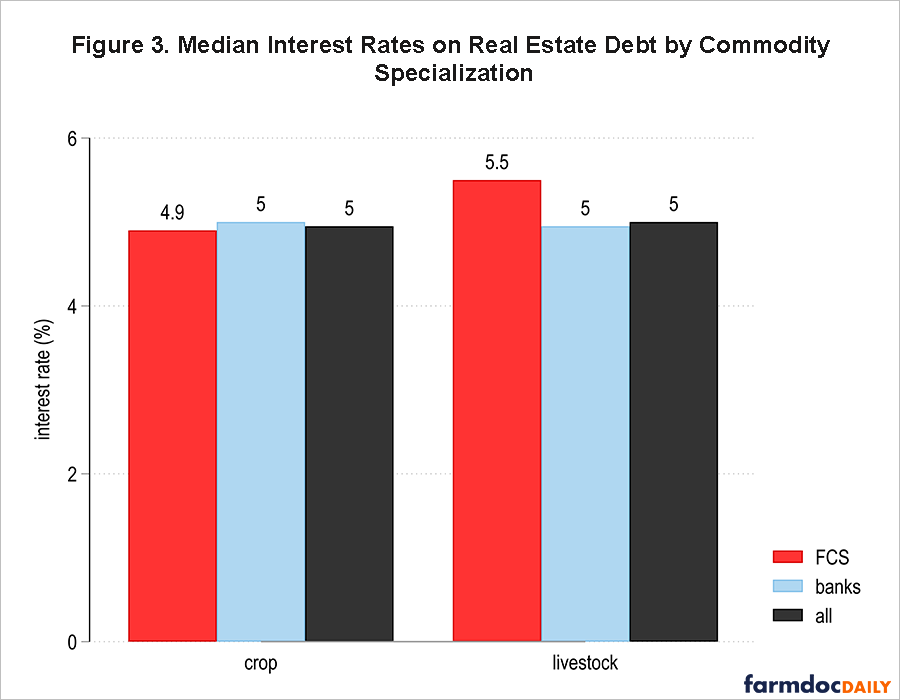
Differences in real estate debt rates across farm classifications were quite small. The median rates paid by crop operations and livestock operations were the same (5%) across all lenders. Likewise, banks and FCS lenders did not charge statistically different rates to crop and livestock farms.
Do Interest Rates Differ by Farm Typology?
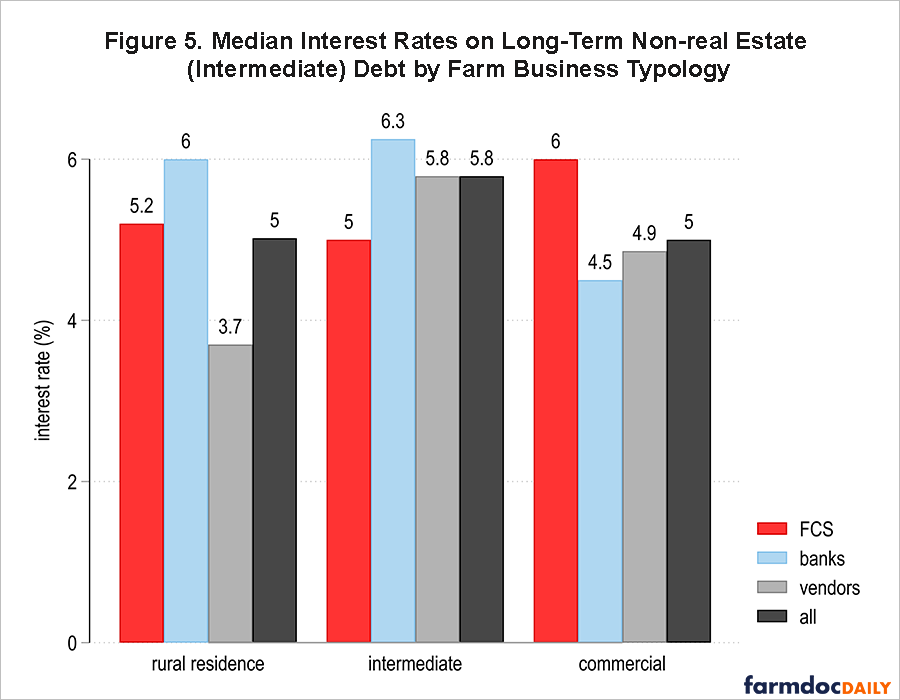
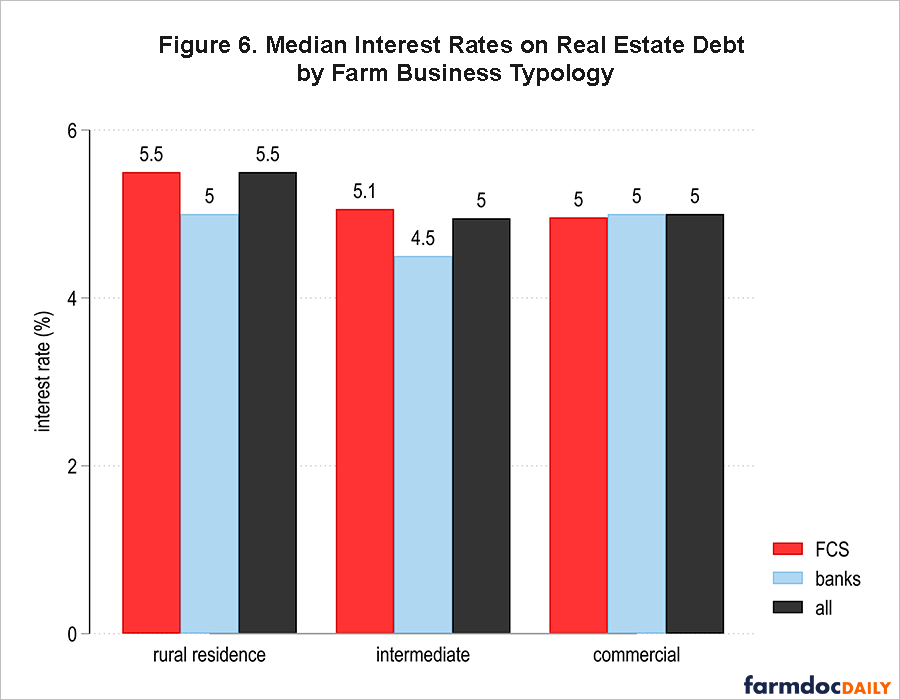
Median interest rates on short-term, intermediate, and real estate debt by farm business typology are shown in Figure 4, Figure 5, and Figure 6, respectively. Across all lenders, rural residence farms had the lowest median rates for short-term non-real estate (5.6%) and intermediate (5%) debt. However, median rates aggregated by lender type were not statistically different for any of the farm typologies.
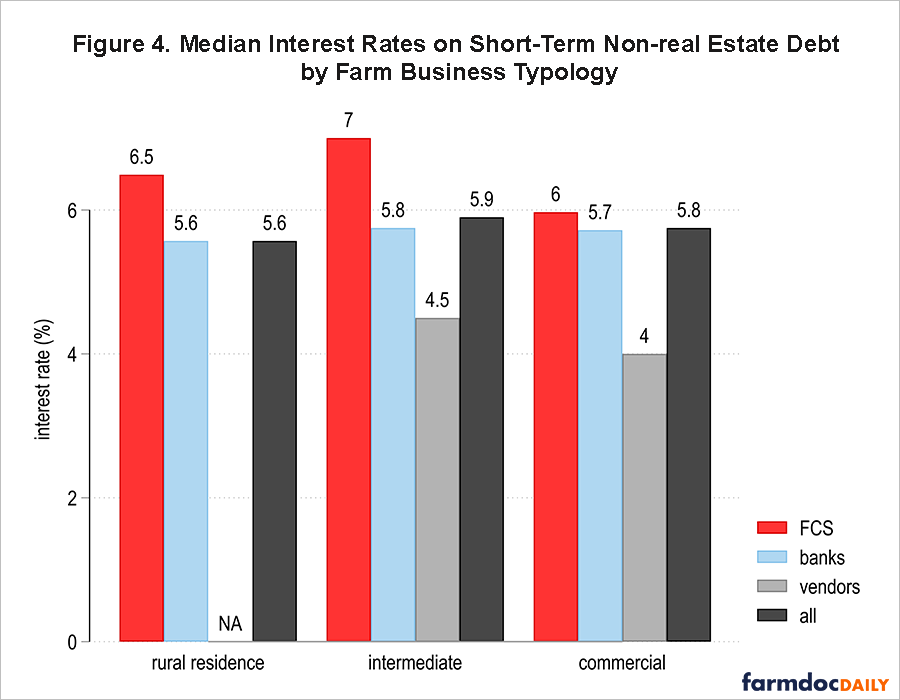
Short-term debt rates charged by FCS lenders or banks were not statistically different across farm sizes. Vendors (4%) provided lower and statistically different short-term rates for commercial farms than banks (5.7%) and FCS lenders (6%). Short-term rates charged by FCS lenders and banks were not statistically different for rural residence farms, but for intermediate farms, rates charged by FCS lenders (7%) were higher and statistically different than those charged by banks (5.8%). Banks (5.7%) and FCS lender (6%) rates on short-term debt for commercial farms were not statistically different.
Interest rates charged by FCS lenders for intermediate debt were not statistically different across farm typologies. However, rates charged by banks were lower and statistically different for commercial farms (4.5%) compared with rates charged to rural residence farms (6%) and intermediate farms (6.3%). On the other hand, vendors charged lower and statistically different rates to rural residence farms (3.7%) relative to intermediate farms (5.8%). This result is similar to the analysis of Ifft, Kuethe, and Patrick (2017). Likewise, commercial farms report higher and statistically different rates on intermediate debt charged by FCS lenders (6%) than rates charged by banks (4.5%). Rates paid by intermediate farms varied across lender types, but they were not statistically different. Rural residence farms reported lower and statistically different rates charged by vendors (3.7%) than rates charged by banks (6%) and FCS lenders (5.2%).
Real estate debt, again, saw greater convergence in rates across lenders. Rates charged by FCS lenders were not statistically different across farm typologies; neither were bank rates. For commercial farms, all lenders, FCS lenders, and banks charged the same median rate (5%). By contrast, intermediate farms received lower rates from banks (4.5%) than commercial farms (5%) did and slightly higher rates from FCS lenders (5.1%). However, the differences were not statistically different.
Conclusion
This analysis found interest rates varied more by farm typology than farm specialization.
- Neither banks nor FCS lenders had consistently higher or lower rates. Bank rates on intermediate debt reported by livestock farms were higher and statistically different from FCS lender and vendor rates. On the other hand, banks had lower rates than FCS lenders for short-term debt made to intermediate farms and intermediate debt made to commercial farms. These differences may reflect use of intermediate debt to finance livestock and machinery.
- Vendors provided lower rates for commercial farms on short-term debt but lower rates for rural residence farms on intermediate debt. Relative to intermediate or commercial farms, rural residence farms may purchase different, smaller types of equipment, which have different financing options. Note, vendor rates may not reflect the full cost of vendor financing (Fiechter and Ifft, 2020).
- Interest rates charged on real estate loans did not vary in a statistically meaningful way across lenders, farm specialization, or farm business typology.
This series revealed differences in interest rates[7] reported by lenders over time and for different locations, farm commodity specializations, and farm business typologies. However, we found more similarities than differences, especially for real estate-backed loans. This rate convergence broadly suggests agricultural credit markets are competitive. However, producers may benefit from “shopping around,” and lenders may be interested in knowing where they are most competitive.
Note, our analysis does not account for specific loan use, loan terms, patronage payments from FCS[8] or other cooperative lenders, or borrower risk, which may explain some of the observed differences. Likewise, some lenders may specialize in specific loan uses — for example, livestock operating loans or irrigation equipment — or farm types and thus may be able to offer more competitive rates as a result of advantages such as more accurate risk assessment or lower appraisal costs. Future research will use statistical models to explore relationships among borrower characteristics and risk, lender cost of funds and interest rates. Although macroeconomic factors will primarily determine whether the Federal Reserve extends its pause on rate increases or decides to make cuts, interest rates are likely to be a farm management focal point over the next decade.
Disclaimer: The findings and conclusions in this presentation are those of the authors and should not be construed to represent any official USDA or U.S. Government determination or policy.
Acknowledgements: This work was supported in part by effort from the Rural and Farm Finance Policy Analysis Center (RaFF) at the University of Missouri, which aims to help policymakers and stakeholders understand rural economic and financial conditions and trends and explore how existing and proposed policies affect rural and farm finances. Alice Roach provided feedback and editorial support.
Notes
[1] Current debt are financial obligations due within 12 months. These often take the form of production loans on the farm balance sheet and are widely used to finance the current year’s agricultural production.
[2] Operation classifications are based on what type of production (i.e., crops or livestock) provided a majority share of 2022 sales. For diversified operations (i.e., mixed operations that produce both crops and livestock) we cannot determine what type of production the debt will be used for.
[3] The farm business typology variable classifies operations based on the primary occupation of the principal operator and gross cash farm income (GCFI) in 2022. Rural residence operations are operations in which the principal operator is retired or is primarily employed in non-farm/ranch work and GCFI is less than $350,000. Intermediate operations are operations in which the principal operator is primarily employed in farm or ranch work and GCFI is less than $350,000. Commercial operations are either (1) operations in which the principal operator is primarily employed in farm or ranch work and GCFI is $350,000 or greater or (2) non-family operations.
[4] The loan data in ARMS does not distinguish between fixed- and variable-rate loans.
[5] Vendors include various forms of trade credit, including input suppliers, implement dealers, co-ops, and other merchants.
[6] Adjusted Wald tests were used to evaluate, whether average interest rates for pairs of lenders, commodity specialization groups, and farm business typology groups were equivalent. The tests were conducted for each debt type (short-term non-real estate, intermediate, and real estate) analyzed. All tests indicating that rates in the pairwise comparison are not equivalent are noted in the text.
[7] Our analysis uses data that is restricted to newly originated debt in the survey year. The interest rate data we present should be interpreted as trends rather than official estimates.
[8] FCS banks and associations paid a total of $2.8 billion cash patronage payments in 2022, which was equivalent to about 39% of net income (FCA 2022).
References
Fiechter, Chad, and Jennifer Ifft. 2020. "Corn Maze." Journal of ASFMRA 2020: 116-121.
Ifft, J., Kuethe, T., & Patrick, K. 2017. “Nontraditional Lenders in the U.S. Farm Economy.” Presentation prepared for the NC-1177 Research Group Annual Meeting, Oct 2-3, Federal Reserve Bank of Minneapolis.
Farm Credit Administration. 2022. “2022 Annual Report of the Farm Credit Administration, Regulator of the Farm Credit System.”
Kreitman, Ty. 2024. “Interest Expenses on Farmland Debt Could Challenge Farm Profitability.” Federal Reserve Bank of Kansas City. Economic Bulletin, February 14.
Disclaimer: We request all readers, electronic media and others follow our citation guidelines when re-posting articles from farmdoc daily. Guidelines are available here. The farmdoc daily website falls under University of Illinois copyright and intellectual property rights. For a detailed statement, please see the University of Illinois Copyright Information and Policies here.