


Farm Loan Interest Rates by Geographic Region
Related Podcast: Navigating Farm Loan Interest Rates (Apr ’24)
In this article, we continue our series on farm debt interest rates by exploring interest rate variation across different U.S. geographic regions. In our previous article (farmdoc daily, February 14, 2024), we looked at trends in median interest rates charged on farm debt issued by Farm Credit System (FCS) lenders, commercial banks, and vendors between 2008 and 2022. We extend this analysis by considering the geographic location of borrowers in 2022 and examine regional differences in median interest rates by lender. As of 2022, the farm sector had $496 billion in outstanding debt. Real estate debt accounted for $335 billion, and non-real estate debt accounted for $161 billion (USDA-ERS 2023).
This analysis uses data from the USDA Agricultural Resource Management Survey (ARMS). ARMS is a nationally representative survey of farm operations[1] that includes information on outstanding farm debt. ARMS collects loan-level information including loan interest rates, loan duration, loan type, loan origination year, and lender characteristics. Using the most recently released ARMS data (2022), we calculate median interest rates on debt (i.e., short-term non-real estate, long-term non-real estate and real estate) issued by FCS lenders, commercial banks (hereafter banks), and vendors[2] across ARMS production regions[3]. Medians, rather than means, are reported to reduce the influence of outliers. The interest rates we report are based on the rates reported by survey respondents; respondents are not asked to distinguish between fixed- and variable-rate products in their responses. For each debt type and lender, we test whether median interest rates are statistically different across regions and lender types.
Do Median Interest Rates Vary Across Regions?
Table 1 provides median interest rates for all lenders, regions, and debt types. After aggregating across lender types[4], median short-term non-real estate debt (short-term) rates ranged from 5% to 6%; short-term rates were only statistically different between the Plains (5.9%) and Atlantic (5.0%) regions. Median rates reported on long-term non-real estate (intermediate) loans also ranged from 5% to 5.9% and were not statistically different among regions. Median rates reported on long-term real estate loans ranged from 4.7% to 6.5%. Real estate loan interest rates were lower and statistically different in the Midwest (4.7%) from the West (4.9%) and the South (6.5%). Overall, we did not see large differences in aggregated median rates for any loan type among regions.
| Table 1. Median Interest Rates on Farm Debt Issued in 2022, by Lender Group and Region | ||||||
| Debt Type |
Lender |
Atlantic | South | Midwest | Plains | West |
| Short-term non-real estate | FCS | 6.5 | 6.8 | 6.0 | 6.0 | 5.3 |
| banks | 4.9 | 4.8 | 5.7 | 5.9 | 5.8 | |
| vendors | – | – | 4.5 | – | – | |
| all | 5.0 | 5.0 | 5.8 | 5.9 | 5.8 | |
| Long-term non-real estate (intermediate) | FCS | 6.4 | 5.0 | 5.0 | 5.2 | 6.8 |
| banks | 3.8 | 5.9 | 5.6 | 6.0 | 5.1 | |
| vendors | 5.0 | 4.3 | 4.5 | 3.9 | 5.5 | |
| all | 5.0 | 5.0 | 5.0 | 5.9 | 5.2 | |
| Real estate | FCS | 5.0 | 6.5 | 5.1 | 5.4 | 5.0 |
| banks | 6.1 | 6.5 | 4.5 | 5.0 | 4.5 | |
| all | 5.0 | 6.5 | 4.7 | 5.0 | 4.9 | |
By lender type, regional differences in interest rates can be substantial — from up to 200 basis[5] points for banks to up to 180 basis points for FCS lenders. Although median interest rates varied for FCS lenders across regions, interest rates reported for FCS lenders were not statistically different across regions in nearly all cases for each loan type. This may be due to FCS lenders having relatively uniform business models and funding structure (i.e., a cooperative model that funds itself through the selling of debt securities). For banks, rates had a few notable regional differences. Median bank interest rates on short-term loans were lower and statistically different in the Plains (6.0%) than in the Atlantic (6.5%) and South (6.8%). Median bank interest rates on intermediate loans were lower and statistically different in the West (5.1%) than in the Plains (6.0%). Median interest rates on bank real estate loans in the South (6.5%) were higher and statistically different from the West and Midwest (both 4.5%) rates, and bank rates in the Midwest were higher and statistically different from the Atlantic region rates (6.1%). Median vendor rates were not statistically different across regions.
Do Rates on Short-Term Loans Vary Within Regions?
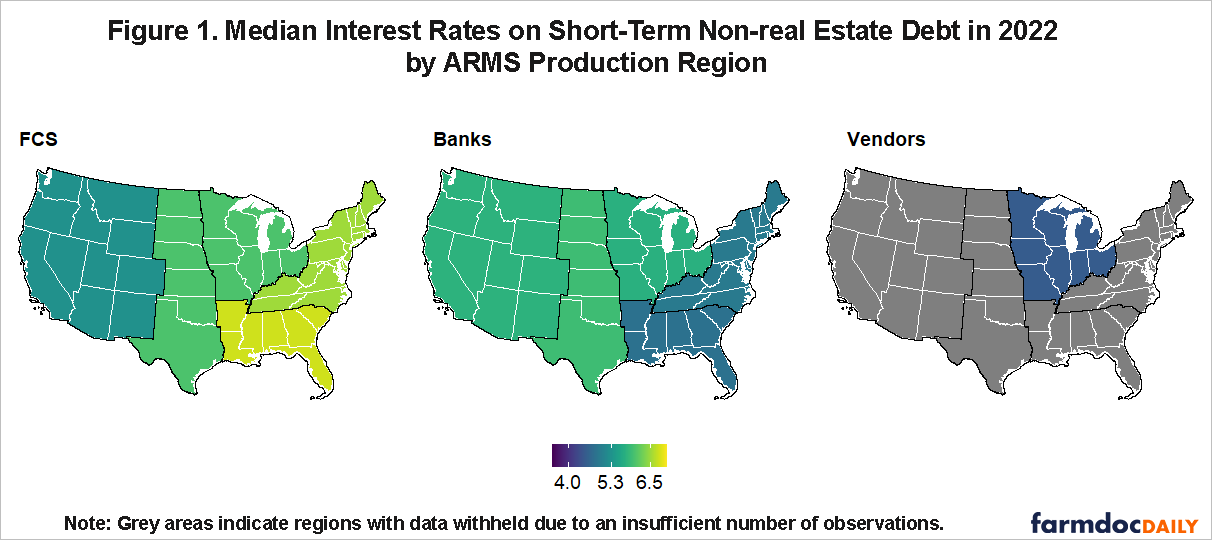
Median interest rates on short-term debt for different ARMS production regions are also shown in Table 1 and Figure 1. For some regions, differences in short-term median rates by lender were quite small —less than 50 basis points. In the Midwest, median rates for FCS lenders and banks were 6.0% and 5.7%, respectively; in the Plains, median rates for FCS lenders and banks were 6% and 5.9%, respectively. In the Atlantic and the South, differences in median rates between FCS lenders and bank lenders were larger at nearly 150 basis points. However, in no region were FCS lender rates and bank rates found to be statistically different from one another. In the Midwest, the only region where we report median rates on short-term loans issued by vendors[6], vendor rates (4.5%) were more than 120 basis points lower than bank rates. However these rates were not statistically different from one another.
Do Rates on Intermediate Loans Vary Within Regions?
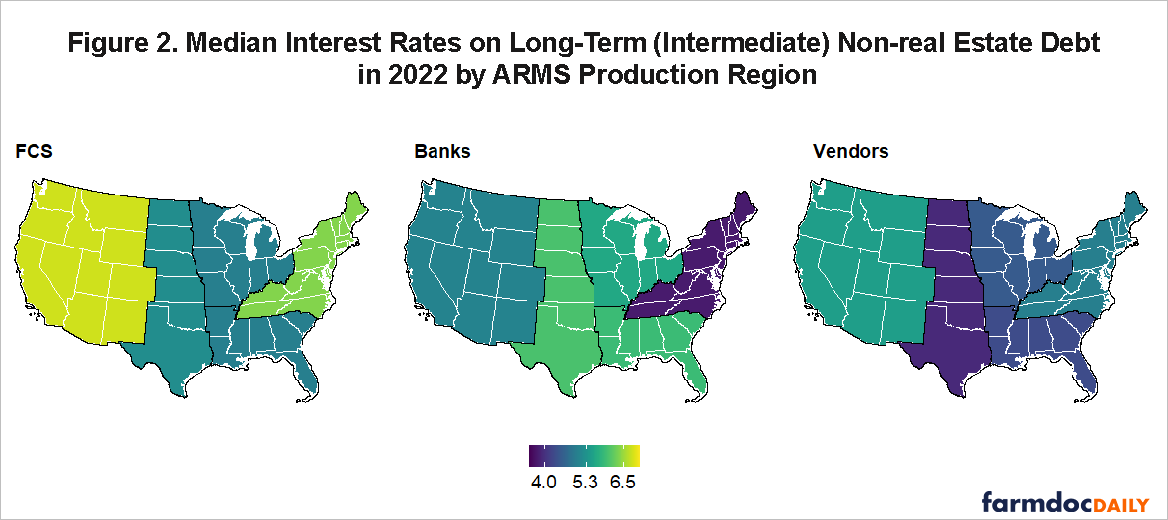
For intermediate debt, regional differences in median rates were larger than differences observed for short-term debt (Table 1 and Figure 2). In the Midwest, median rates for vendors (4.5%) were lower and statistically different from FCS lender (5.0%) and bank (5.6%) rates. In the Plains region, rates charged by banks (6.0%) were higher and statistically different from vendor (3.9%) and FCS lender (5.2%) rates. The lower median rates vendors offered on intermediate loans in some regions may reflect marketing or pricing strategies (Fiechter and Ifft, 2020).
Do Rates on Real Estate Loans Vary Within Regions?
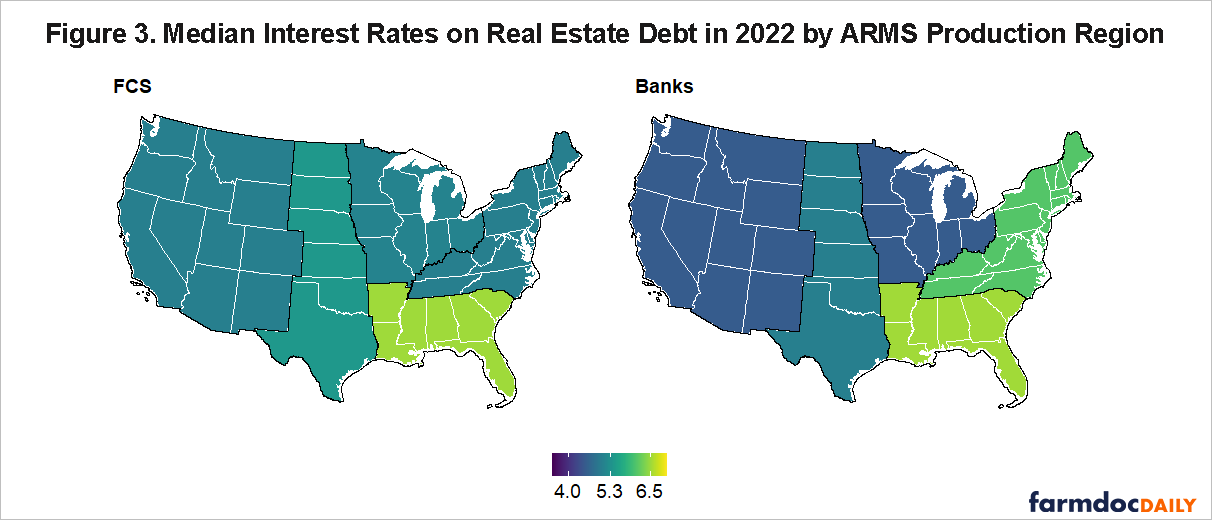
Median interest rates on real estate debt are shown by region in Table 1 and Figure 3. Regional differences in rates between FCS lenders and banks were quite small, ranging from 0 to 110 basis points – the smallest range of all three loan types. Rates within regions were not statistically different other than between FCS lenders (5.0%) and banks (4.5%) in the West. Broadly, this suggests competitive markets for real estate loans.
How Do Interest Rates Reported in Arms Compare with Rates Mentioned in Bank Surveys?
We compare interest rates reported in ARMS to rates included in regional quarterly Federal Reserve Agricultural Credit Surveys. Averaging across quarters, the Dallas Federal Reserve reported banks in the Eleventh District[7] charged 6.4% on average for variable-rate intermediate loans in 2022, and the Kansas City Federal Reserve reported banks in the Tenth District[8] charged an average of 6.1% (Dallas Federal Reserve 2023; Kansas City Federal Reserve 2023). Note, most short-term or operating loans have variable rates. These averages are higher than the rates reported in ARMS, but from the beginning to the end of 2022, the Federal Open Market Committee increased the target rate by more than 400 basis points. The wide variation we observe in interest rates may be at least partly due to when an operation applies for credit and consequently depend on regional differences in commodity specialization and the timing of the growing season.
We also averaged quarterly 2022 data on average interest rates for fixed-rate intermediate loans from the Agricultural Credit Surveys and found banks in the Eleventh District (i.e., Dallas Fed) charged 6.5% on intermediate loans during this period, and banks in the Tenth District (i.e., Kansas City Fed) charged 6.2%. Real estate interest rates reported in ARMS are not dissimilar to the annual average of fixed real estate interest rate data from the Kansas City Federal Reserve (5.9%) and the Dallas Federal Reserve (6.1%). Rates reported across surveys are broadly comparable; the differences may reflect different respondent groups and survey timing.
Conclusion
In many cases, lenders charge comparable interest rates across and within regions; however, this analysis did uncover some differences[9]. FCS lender and vendor rates typically were not statistically different between regions, but rates were statistically different among banks across regions for some loan types. Interest rates for short-term loans were not statistically different between FCS lenders and banks in any region, and real estate loans were only statistically different between FCS lenders and banks in the West. In the Midwest, vendors had lower median rates for intermediate loans relative to banks and FCS lenders. In the Plains and West, banks had higher median rates for intermediate loans.
To some degree, these differences could reflect regional differences in production systems, land productivity, and borrower risk. Further, different lenders may provide different types of credit within each loan category — for example, breeding stock versus machinery loans. The final article in this series will compare interest rates for farms of different sizes and commodity specialization.
Disclaimer: The findings and conclusions in this presentation are those of the authors and should not be construed to represent any official USDA or U.S. Government determination or policy.
Acknowledgements: This work was supported in part by effort from the Rural and Farm Finance Policy Analysis Center (RaFF) at the University of Missouri, which aims to help policymakers and stakeholders understand rural economic and financial conditions and trends and explore how existing and proposed policies affect rural and farm finances. Alice Roach provided feedback and editorial support.
Notes
[1] ARMS is fielded in January and February each year and collects information on the farm household and operation from the preceding year.
[2] Vendors include various forms of trade credit, including input suppliers, implement dealers, co-ops, and other merchants.
[3] ARMS recognizes five (geographic) production regions in the contiguous lower 48 states: Atlantic, South, Midwest, Plains, and West. This analysis did not account for lender locations. Instead, debt in a particular production region reflects the location of the operator/borrower.
[4] See the “all” category in Table 1.
[5] 100 basis points equal 1 percentage point; for example, an increase in interest rates from 3% to 4% would be an increase of 100 basis points.
[6] In regions where the total number of observations in 2022 was lower than 15, no analysis is reported.
[7] The Eleventh District consists of Texas, northern Louisiana, and southern New Mexico.
[8] The Tenth District consists of Oklahoma, Kansas, Nebraska, Colorado, Wyoming, the northern half of New Mexico, and the western third of Missouri.
[9] Our analysis uses ARMS data that is restricted to newly originated debt in the survey year. The interest rate data we present should be interpreted as trends rather than official estimates.
References
Federal Reserve Bank of Kansas City, Survey of Agricultural Credit Conditions. 2023. Available online: Ag Credit Survey - Federal Reserve Bank of Kansas City (kansascityfed.org)
Federal Reserve Bank of Dallas, Survey of Agricultural Credit Conditions. 2023. Available online: Eleventh District Agricultural Data - Dallasfed.org
Fiechter, C., andJ. Ifft. 2020. Corn Maze. Journal of ASFMRA, 116-121.
Miller, N., J. Ifft and G. Mashange. "Farm Loan Interest Rate Trends by Major Lender Groups." farmdoc daily (14):31, Department of Agricultural and Consumer Economics, University of Illinois at Urbana-Champaign, February 14, 2024.
U.S. Department of Agriculture, Economic Research Service (USDA-ERS). 2023. “U.S. and State Farm Income and Wealth Statistics.” Available online: USDA ERS - Data Files: U.S. and State-Level Farm Income and Wealth Statistics
Disclaimer: We request all readers, electronic media and others follow our citation guidelines when re-posting articles from farmdoc daily. Guidelines are available here. The farmdoc daily website falls under University of Illinois copyright and intellectual property rights. For a detailed statement, please see the University of Illinois Copyright Information and Policies here.