


Liquidity Trends for Illinois Farms: A Regional Comparison of Current Ratios from 2003-2022
This article examines the current ratio trends of Illinois grain farms using data obtained from the Illinois Farm Business Farm Management (FBFM). It builds upon our previous analysis (farmdoc daily, December 4, 2023) of the working capital trends of Illinois grain farms to provide further insights into their financial health. The current ratio is a measure of liquidity that assesses a farm’s ability to meet its short-term financial obligations as they become due. It is calculated by dividing the value of a farm’s current assets[1] by its current liabilities[2]. In other words, it measures a farm’s ability to pay off its short-term liabilities with its short-term assets. According to the Farm Financial Scorecard[3] developed by the Center for Farm Financial Management, a farm with a current ratio that is less than 1.3 is categorized as vulnerable, a ratio between 1.3 and 2.0 is categorized as cautionary, and a ratio that is greater than 2.0 is categorized as strong. Therefore, the higher the current ratio, the more liquid the farm is.
In our analysis, we report the annual average current assets and current liabilities of grain farms in Illinois. We then use these values to calculate the implied current ratio (hereafter, current ratio). This approach will also allow us to discuss the relative changes in current assets and current liabilities driving the current ratio trends. Additionally, we also discuss the current ratio trends across three regions—Northern, Central, and Southern Illinois. Lastly, in our figures below, we use the color-coding system of the Farm Financial Scorecard to indicate the category under which the average farm’s current ratio belongs. The region shaded in red indicates a vulnerable ratio, while yellow indicates a cautionary ratio, and green indicates a strong ratio.
Illinois Farms
Figure 1 shows the average current assets, current liabilities, and current ratio of Illinois farms. The liquidity of Illinois farms has substantially improved over the years. From 2003 to 2006, the current ratio of the average Illinois farm was in the cautionary range, but there was a gradual improvement in liquidity during this period. The average current assets of farms increased by 43.39%, from $255,691 to $366,635, while average current liabilities increased by 24.41%, from $148,711 to $185,007. As a result, the current ratio increased by 15.12%, from 1.72 to 1.98.
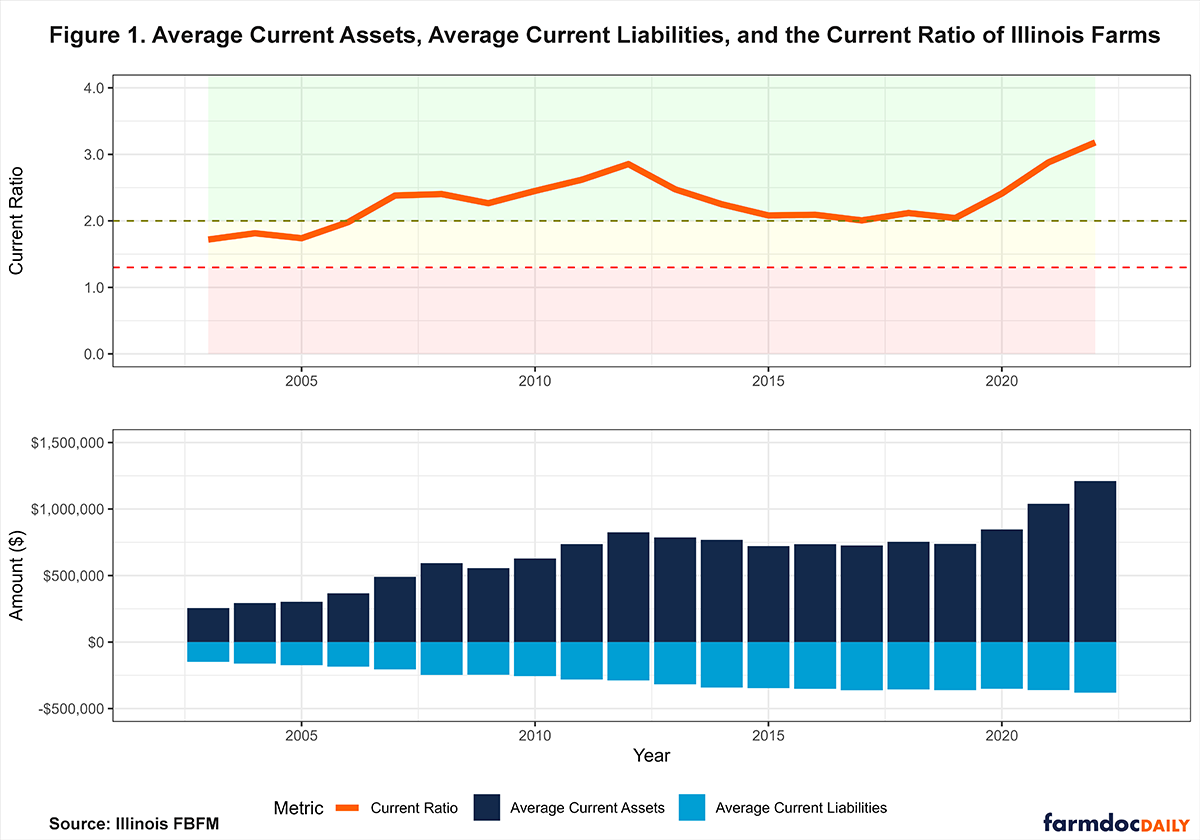
Since 2007, the liquidity of Illinois farms has remained strong, as evidenced by the current ratio sustaining a value above 2.00. There was a considerable increase in the current ratio from 2007 to 2012, as the current assets of farms increased at a faster rate than their current liabilities. This was mainly due to higher commodity prices at the time, driven by the increased demand for soybeans in export markets and corn for ethanol production. However, the current ratio began to trend downwards from 2012 to 2015, as average current assets declined while current liabilities continued to increase during that period. The ratio of average current assets to current liabilities was relatively unchanged from 2015 to 2019, resulting in a flat current ratio in that period. During this period, we also saw lower net farm incomes, with 2015 having the lowest average net farm income since the 1980s.
The onset of the COVID-19 pandemic coincided with a rapid increase in average current assets, which rose from $738,023 in 2019 to $846,662 in 2020, a 14.72% increase, while current liabilities fell from $361,312 to $351,132, a 2.82% decrease. As a result, the current ratio increased by 18.12% from a ratio of 2.04 in 2019 to 2.41 in 2020. As of 2022, the current ratio of the average Illinois farm stood at 3.18, where average current assets were $1,210,605 and average current liabilities were $380,752. The recent increase in liquidity can be attributed to several factors, including the rise in farm incomes due to higher grain prices, particularly after the Russian invasion of Ukraine in 2022. Additionally, these price increases led to higher inventory values, large cash reserves, and lower operating debt. Overall, the current ratio of the average Illinois farm increased by 84.89% from 2003 to 2022. During this period, average current assets increased by 373.43%, and average current liabilities increased by 156.03%.
Northern Illinois Farms
Figure 2 shows the average current assets, current liabilities, and current ratio of Northern Illinois farms. Over the last two decades, Northern Illinois farms have shown a significant improvement in their liquidity, similar to the trend observed for all farms in Illinois. Between 2003 and 2006, the current ratio increased but remained in the cautionary range. During this period, the average current assets of these farms grew by 50.93%, from $271,690 to $410,056, while the average current liabilities increased by 27.55%, from $171,196 to $218,360. Consequently, the current ratio rose by 18.19%, from 1.59 to 1.88.
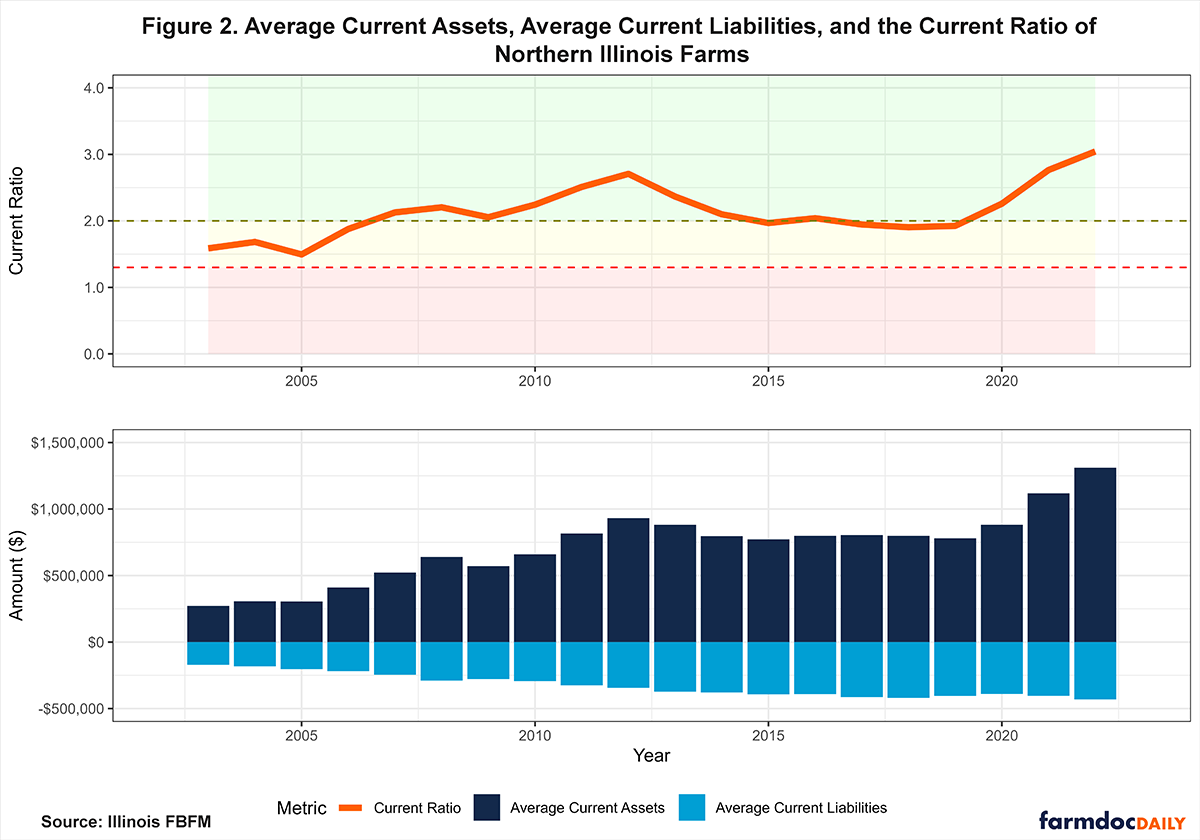
The period from 2007 to 2012 marked a substantial improvement in liquidity, which was in line with the trend across the state. The growth in average current assets outpaced current liabilities, leading to a rise in the current ratio. However, from 2012 to 2015, a similar decline in the current ratio was observed, as the current assets decreased while the current liabilities continued to increase. This caused the current ratio to fall back into the cautionary range. Thereafter, the current ratio remained in the cautionary range until it broke into the strong range in 2020. As of 2022, the current ratio of an average Northern Illinois farm was 3.04, with average current assets of $1,310,762 and average current liabilities of $430,694. Overall, the current ratio of the average farm in Northern Illinois increased by 91.77% from 2003 to 2022, compared to 84.89% for all farms in Illinois. Average current assets increased by 382.45%, while average current liabilities increased by 151.58%.
Central Illinois Farms
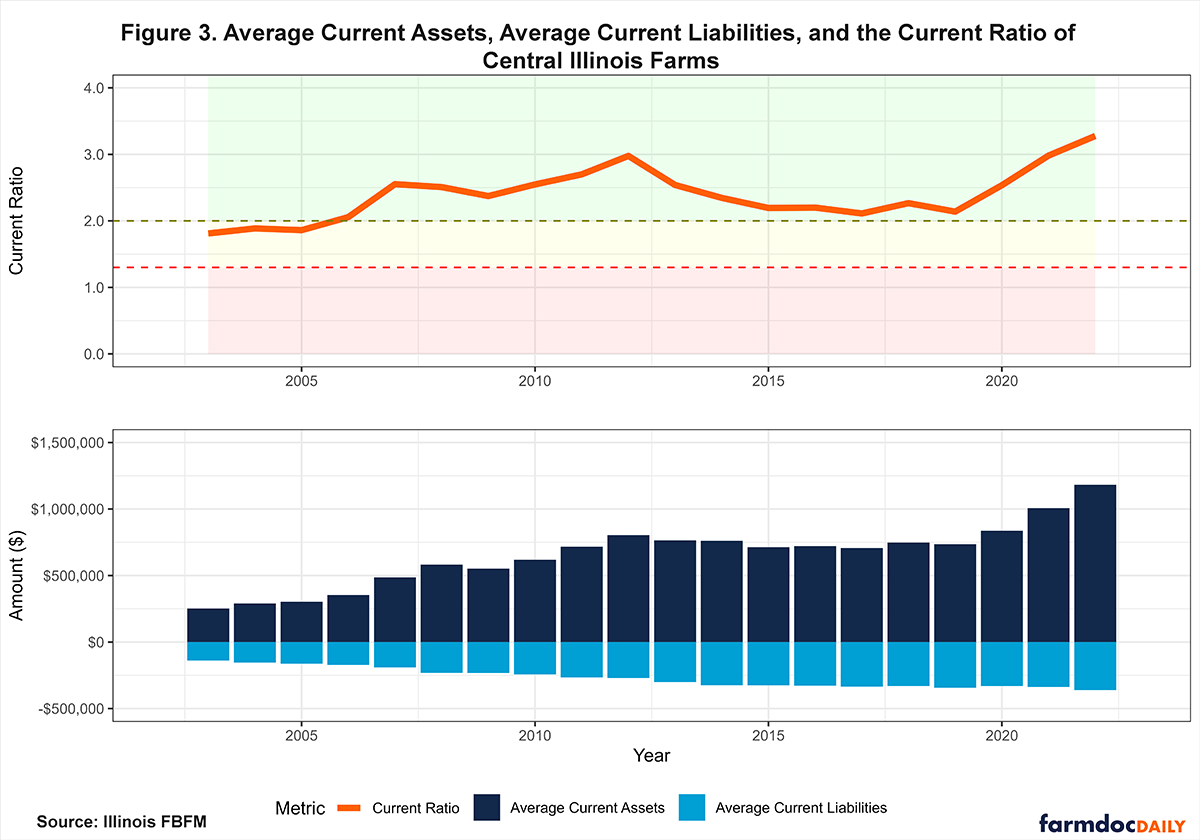
Figure 3 shows the average current assets, current liabilities, and current ratio of Central Illinois farms. On average, farms in this region have been more liquid than those in Northern and Southern Illinois, with a consistently higher current ratio across all years. These farms have remained in the strong range since 2006, unlike farms in the other two regions, which saw their current ratio decline into the cautionary range in some years. Additionally, these farms have the lowest short-term obligations on average compared to farms in Northern and Southern Illinois. In 2003, the average current assets of farms in Central Illinois were $251,609 compared to $271,690 in Northern Illinois and $231,228 in Southern Illinois. At that time, average current liabilities were $138,916 compared to $171,197 in Northern Illinois and $150,111 in Southern Illinois. Since then, the average current assets of Central Illinois farms have increased by 370.02% to $1,182,621, and current liabilities have increased by 159.81% to $360,923, resulting in the current ratio increasing by 80.91%.
Southern Illinois Farms
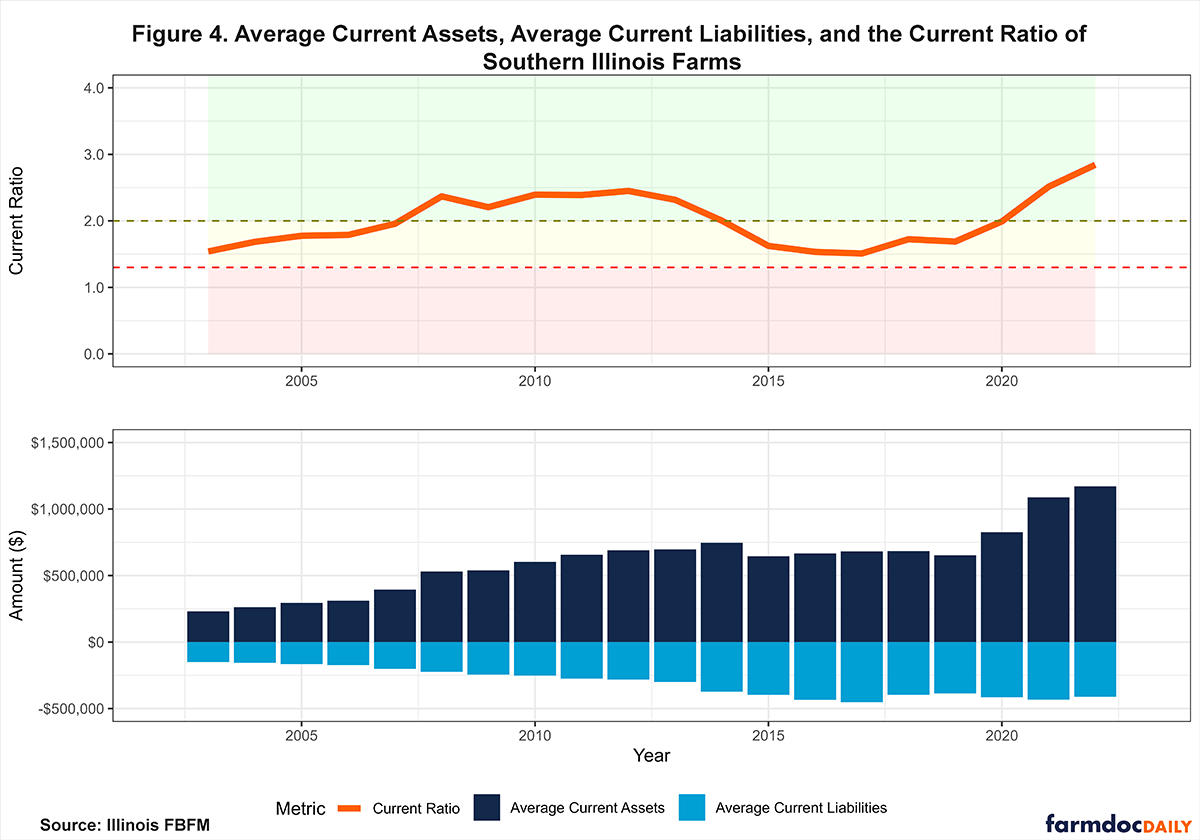
Figure 4 shows the average current assets, current liabilities, and current ratio of Southern Illinois farms. On average, farms in Southern Illinois are less liquid and are more likely to be in the cautionary range compared to farms in other regions. For instance, the current ratio of these farms has been in the cautionary range in 11 out of the 20 years of reported data, compared to 3 years for farms in Central Illinois, and 8 years for farms in Northern Illinois. Although farms across all regions saw their current ratio decline between 2012 and 2019, farms in Southern Illinois reached lower levels compared to farms in the other two regions. One reason is the higher yield variability due to the soil type in the region, which can be impacted by excess or little precipitation. For example, the current ratio fell to 1.51 in 2017, which was the lowest observed value across all regions in our 20-year reporting period. Additionally, the average current assets fell by 5.43% between 2012 and 2019 in Southern Illinois, compared to a decline of 8.57% in Central Illinois, and a decline of 16.27% for farms in Northern Illinois. However, current liabilities in Southern Illinois had the highest rate of increase out of the three regions during this period, increasing by 37.20%, compared to an increase of 27.22% in Central Illinois, and an increase of 17.75% in Northern Illinois. Farms in this region have since improved their liquidity as the current ratio increased from 1.68 in 2019 to 2.84 in 2022. As of 2022, average current assets were $1,171,011, while average current assets were $411,917. Overall, the current ratio of the average Southern Illinois farm increased by 84.55% from 2003 to 2022, with average current assets increasing by 406.43% and average current liabilities increasing by 174.41%.
Conclusion
In conclusion, our current ratio analysis of Illinois grain farms using data from the Illinois Farm Business Farm Management (FBFM) indicates a substantial improvement in liquidity over the past two decades. The average current assets of farms have increased significantly, outpacing the growth in current liabilities, resulting in a rise in the current ratio. However, there have been periods of decline in the current ratio, particularly from 2012 to 2015, where average current assets decreased while average current liabilities continued to increase. Nonetheless, the current ratio of the average Illinois farm has remained strong since 2007, and the onset of the COVID-19 pandemic coincided with a further increase in liquidity. As we move into the 2024 growing season with projected lower farm incomes, these higher current ratios will help farmers offset the lower prices. Careful monitoring of this ratio is needed to help understand the liquidity of the farm operation.
Acknowledgment
The authors would like to acknowledge that data used in this study comes from the Illinois Farm Business Farm Management (FBFM) Association. Without Illinois FBFM, information as comprehensive and accurate as this would not be available for educational purposes. FBFM, which consists of 5,000+ farmers and 70 professional field staff, is a not-for-profit organization available to all farm operators in Illinois. FBFM field staff provide on-farm counsel along with recordkeeping, farm financial management, business entity planning and income tax management. For more information, please contact our office located on the campus of the University of Illinois in the Department of Agricultural and Consumer Economics at 217-333-8346 or visit the FBFM website at www.fbfm.org.
Notes
[1] Current assets consist of assets that are expected to be converted into cash within one year.
[2] Current liabilities consist of obligations that are due within one year.
[3] The Farm Financial Scorecard adheres to the guidelines set by the Farm Financial Standards Council.
References
Mashange, G. and B. Zwilling. "Working Capital Trends for Illinois Farms: A Regional Comparison from 2003-2022." farmdoc daily (13):219, Department of Agricultural and Consumer Economics, University of Illinois at Urbana-Champaign, December 4, 2023.
Disclaimer: We request all readers, electronic media and others follow our citation guidelines when re-posting articles from farmdoc daily. Guidelines are available here. The farmdoc daily website falls under University of Illinois copyright and intellectual property rights. For a detailed statement, please see the University of Illinois Copyright Information and Policies here.