


Trends in Working Capital and Financial Solvency
Many of you have finished or are still completing your 2023 financial statements. It is important to take time to prepare a complete and accurate set of financial documents that include an accrual income statement and a balance sheet. Those two documents…or better yet, a series of those two documents from several years provide valuable financial facts about your farm business. The accrual income statement measures the net revenue income that results from the fruits of your management skills and the local/global economic environment in which your farm operates. Your balance sheet (at fair market value or FMV) is a ‘stock’ measure at a point in time (usually December 31) of the assets in your farm business and the claims of ownership (via debt or equity) on those assets. There is no substitute for a good set of financial records that can be used to make decisions.
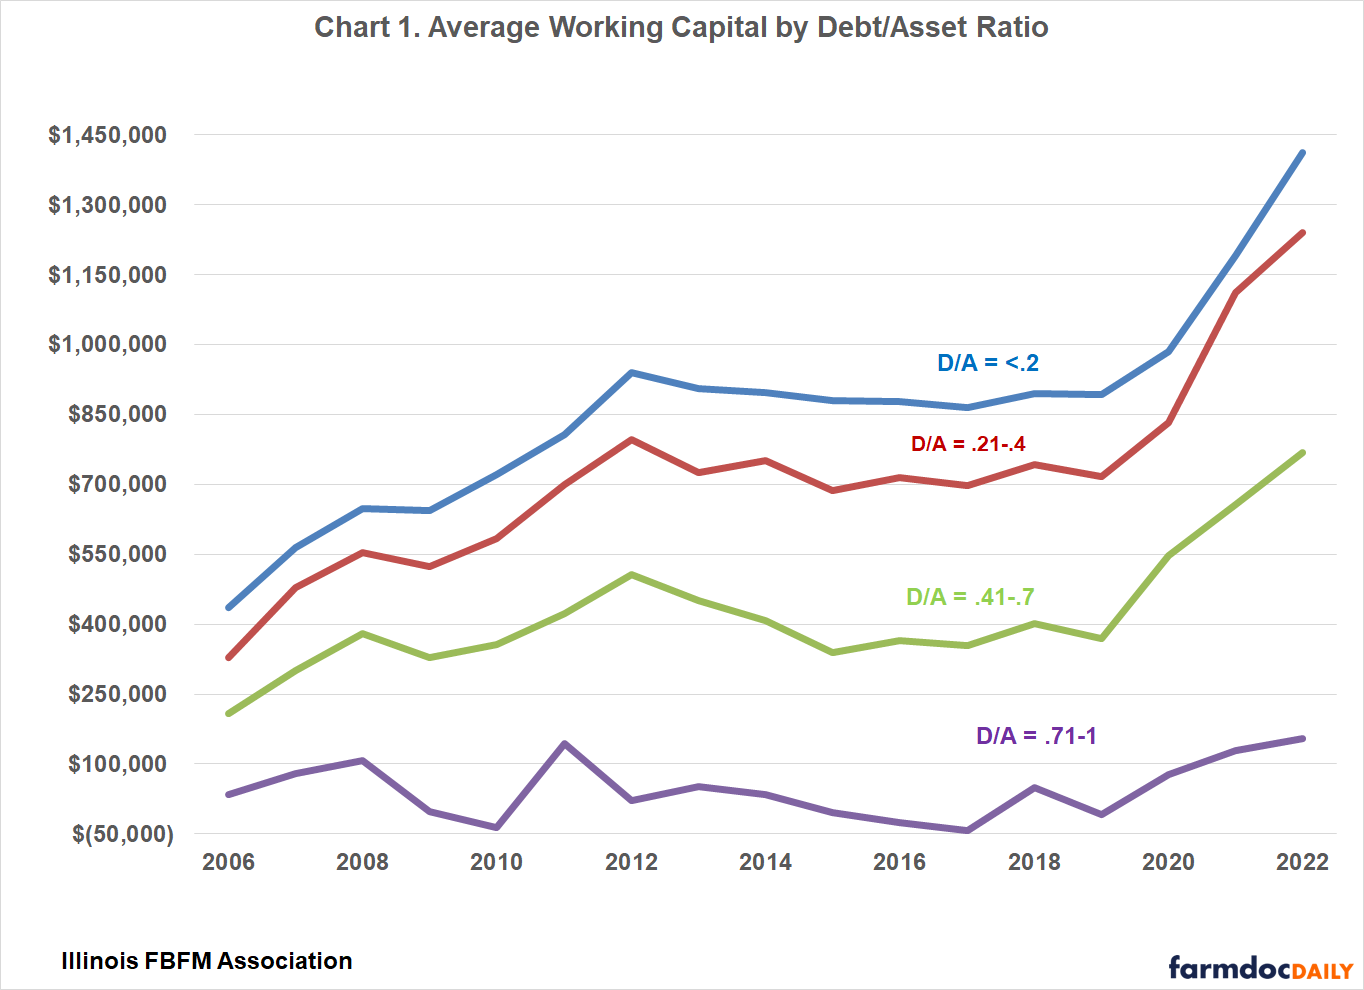
This article reviews trends in working capital as they relate to the debt-to-asset ratio. This data, from a seventeen-year period (2006-2022) is provided by farm operations participating in the Illinois Farm Business Farm Management Association. Working capital is derived by subtracting current liabilities from current assets. The observations are separated into one of four groups by debt-to-asset (D/A) ratio. The four debt-to-asset ratio groups are: 1) .20 or less, 2) .21 to .40, 3) .41 to .70 and 4) .71 to 1. Recall that the debt-to-asset ratio reveals the percentage of your assets that your lender owns. The calculation takes total debt and divides by total assets. For example, a debt-to-asset ratio of .25 means that for every $1,000 of assets there is an obligation to a lender of $250 on those assets. Debt-to-asset ratios tend to be greater for younger farm operators who are at the outset of their farming career. Likewise, debt-to-asset ratios tend to be lesser for older farm operators as the seasoned farm operator has had a lifetime to pay down debt initially acquired at a younger age.
Chart 1 shows the mean working capital for each of the four debt-to-asset groups for the seventeen-year period. For all four groups, working capital was at its greatest level in 2022 (that was also the highest accrual net farm income year as well). The three lowest debt-to-asset ratios groups show the least amount of working capital in 2006, while the highest debt-to-asset ratio group shows the least working capital in 2017. It is easy to note from the chart the trend of greater debt-to-asset ratios being associated with lesser amounts of working capital. Further, each one of the seventeen years shows a declining amount of working capital as the debt-to-asset ratio increases with the greatest debt-to-asset ratio group showing negative working capital in six of the seventeen years. The average percentage decrease in working capital as the debt-to-asset ratio increases is a 17 percent decrease from group 1 (.20 or less) to group 2 (.21 to .40) , a 41 percent decrease from group 2 (.21 to .40) to group 3 (.41 to .70), and a 90 percent decrease from group 3 (.41 to .70) to group 4 (.71 to 1).
Working capital is the short-term reserve of cash or near cash that permits a farm business to respond to ordinary financial needs or take advantage of opportunities to expand one’s farming business. It is necessary to maintain an adequate level of working capital to weather the ups and downs of financial cycles and economic conditions. Adequate amounts of working capital depend on many factors including the size of farm operation and the financial and operational risk associated with the farm. As an absolute dollar amount it is difficult to compare working capital between farms. Table 1 is presented to evaluate working capital from a relative perspective. Table 1 shows working capital relative to the number of acres and working capital relative to gross farm revenue. Many would suggest that working capital relative to gross farm returns should be at .15 to .25 if not higher. Table 1 indicates that the farms in this dataset maintain working capital relative to gross farm returns at a level that exceeds the .15 to .25 level. This measure was at its greatest in 2022 (0.534) and at its least in 2006 (0.325). Working capital per operator acre reached a peak in 2012 ($540/operator acre) and had diminished considerably to the 2017 level of $281 per operator acre but since 2019 the increase has averaged over 30 percent per year. The largest one-year percent increase was in 2007 when the increase was over 70% from 2006 for working capital per operator acre.
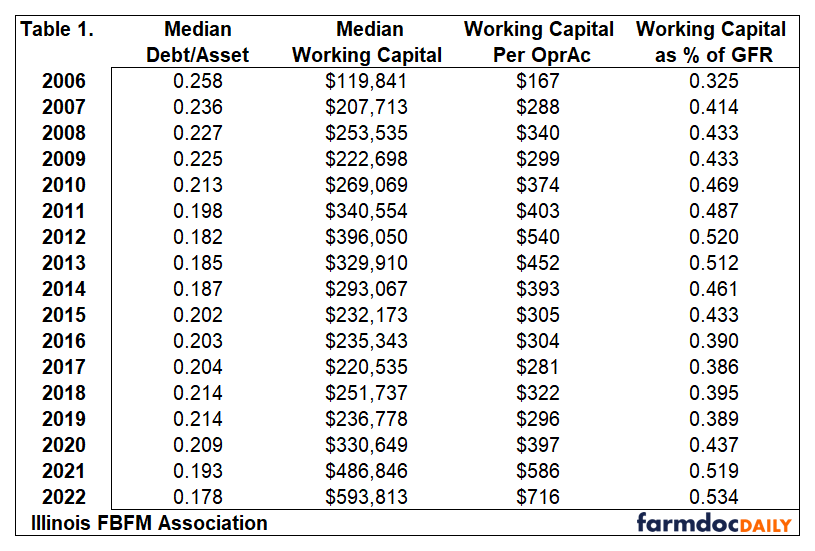
Table 1 also shows the median debt-to-asset ratio for each year with the lowest ratio in 2022 and the highest in 2006. The median amount of working capital is present in this table as well showing the greatest amount of working capital in 2022 and the least in 2006.
On average, as one’s debt-to-asset ratio rises, working capital will decrease. The increase can be driven by a decrease in asset values or an increase in liabilities. Many times, the increase in debt-to-asset ratio is driven by an increase in debt. Typically, all terms of debt have some impact on current liabilities as there is a current portion and accrued interest on those loans that are considered current liabilities. Carefully monitoring of your yearly financial reports and records will allow you to compare your financial numbers and ratios over time. With this yearly trend information, farm financial management decisions can be made with a better understanding of the potential impact on your farm operation.
The author would like to acknowledge that data used in this study comes from the Illinois Farm Business Farm Management (FBFM) Association. Without Illinois FBFM, information as comprehensive and accurate as this would not be available for educational purposes. FBFM, which consists of 5,000+ farmers and 70 professional field staff, is a not-for-profit organization available to all farm operators in Illinois. FBFM field staff provide on-farm counsel along with recordkeeping, farm financial management, business entity planning and income tax management. For more information, please contact our office located on the campus of the University of Illinois in the Department of Agricultural and Consumer Economics at 217-333-8346 or visit the FBFM website at www.fbfm.org.
Disclaimer: We request all readers, electronic media and others follow our citation guidelines when re-posting articles from farmdoc daily. Guidelines are available here. The farmdoc daily website falls under University of Illinois copyright and intellectual property rights. For a detailed statement, please see the University of Illinois Copyright Information and Policies here.