


Crop Insurance Decisions for 2024
The 2024 price discovery period used to determine projected prices and volatility factors for Federally-sponsored corn and soybean crop insurance products is completed for areas with a March 15th sales closing date (SCD). For the majority of the corn belt, the approved Projected Price (PP) for corn is $4.66 and the Volatility Factor is 0.19, and for soybeans, the Projected Price is $11.55 with a Volatility Factor of 0.15. These represent substantially lower prices than in recent years and will result in lower premiums in general and correspondingly lower insured revenue levels.
Table 1 below contains Projected Prices, Volatility Factors, and Harvest Prices for the previous 14 years. The Projected Price (PP) and Harvest Price (HP) are futures price measures used to determine guaranteed revenue and actual revenue for Federal crop insurance, and do not reflect the local cash basis. The Projected Price for corn is determined by averaging the closing December futures price during the trading days of February, and for soybeans by averaging the November Futures closing prices during February. The Volatility Factors are determined by an average of the most recent five trading days’ implied volatility estimates, scaled for the interval of time from now until the middle of October — the month during which average prices are used to determine Harvest Prices. Bolded values in Table 1 indicate which of the PP and HP measures was greater in a given year.
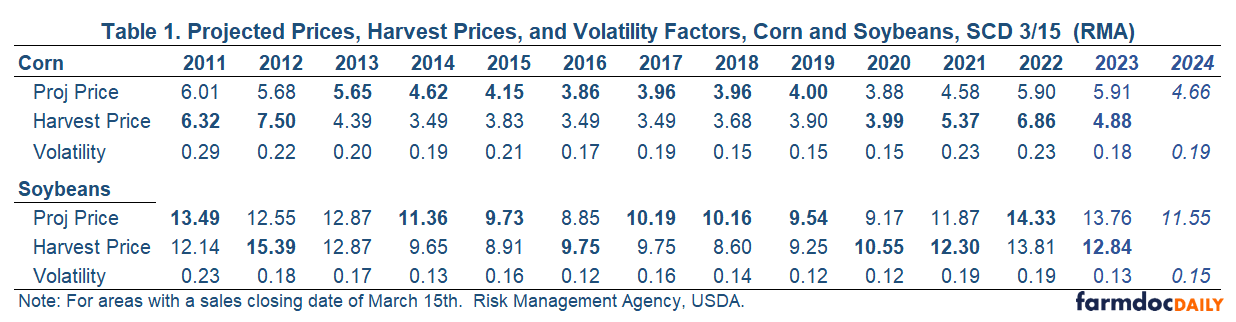
For corn, the projected price is $4.66 or 21% below last year’s PP, and for soybeans the PP is $11.55 or 16% below the 2023 projected price. In simplest terms, a producer with a 225 bushel APH insuring at an 85% coverage level would have $891 of insured revenue (0.85 x $4.66 x 225) compared to $1,130 in 2023 (0.85 x $5.91 x 225).
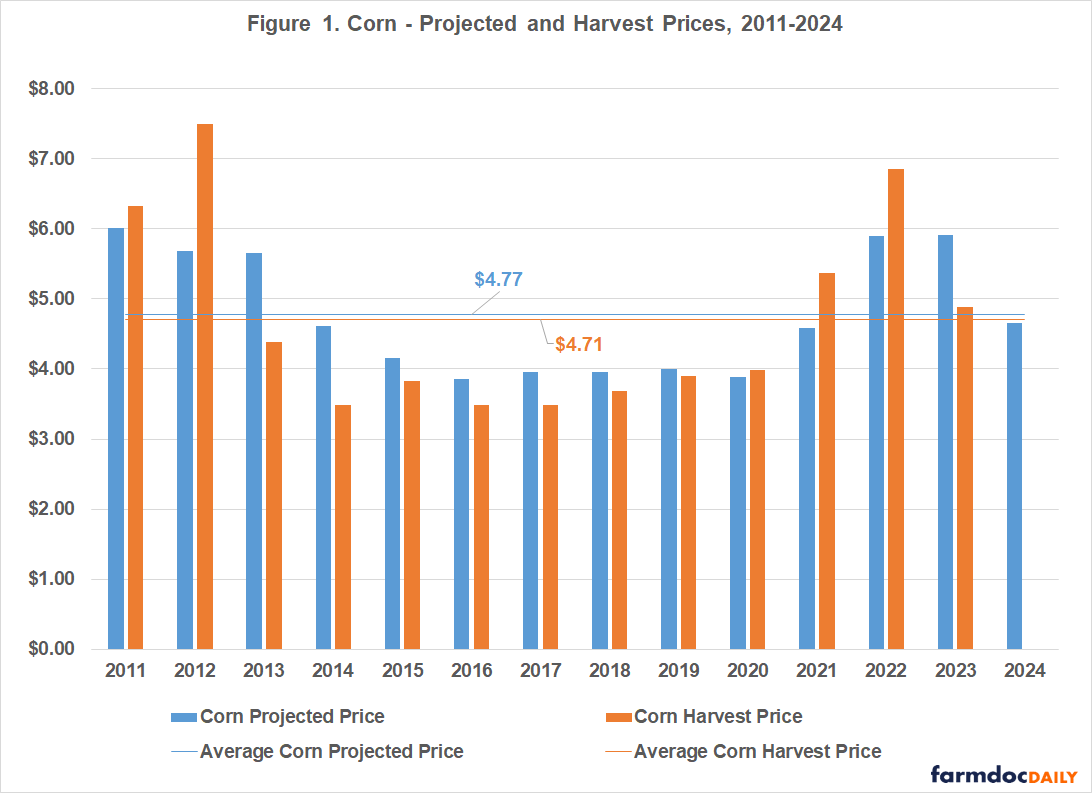
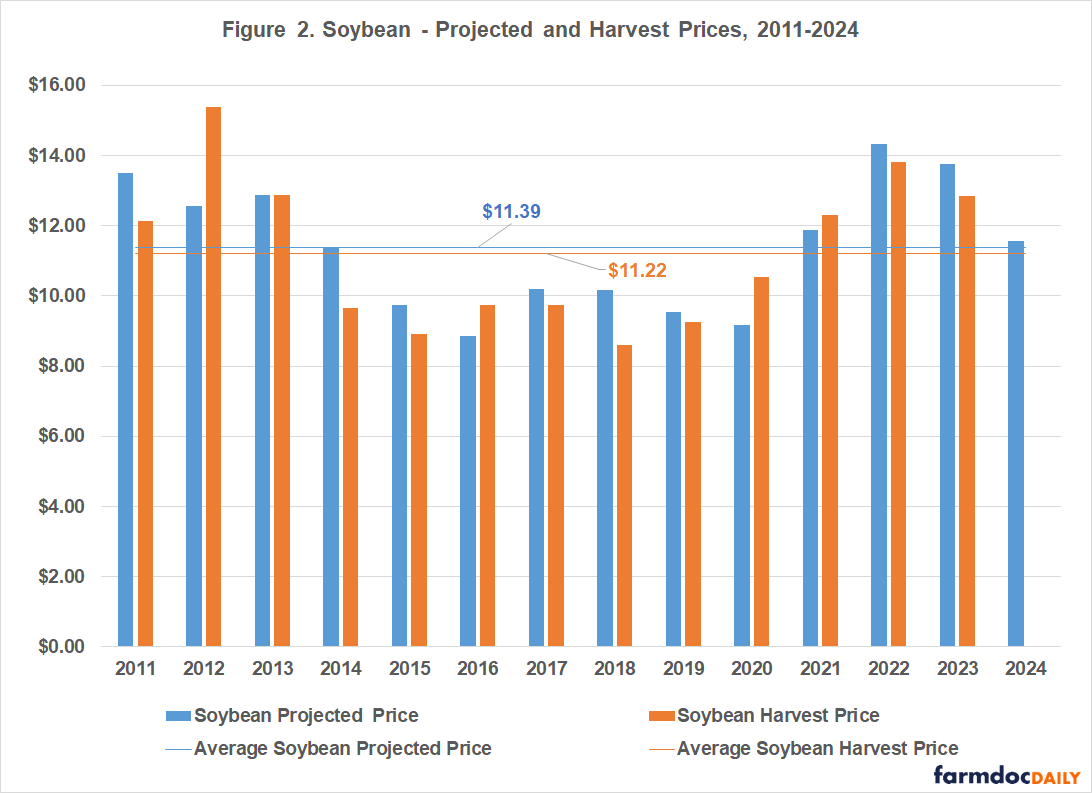
Figures 1 and 2 below provide a graphical depiction of the same information along with the long run averages for each crop. In the case of corn, the historic pattern has been that the Harvest Price has averaged about $0.06 below the Projected Price, and for soybeans, the Harvest Price has averaged about $0.17 below the Projected Price.
During February this year, the futures prices for both corn and soybeans trended downward during the month resulting in Projected Prices that are above the current futures prices for both corn and soybeans. The Dec corn futures contract is trading just a few cents below the PP but Nov Soybean futures are trading $0.11-$0.15 below the projected price at the time of this writing. This relationship has important implications for the risk management provided by crop insurance, as the initial coverage levels are slightly above the levels of revenue implied by the current futures trade, and thus the initial crop insurance position would be viewed as being partly “in-the-money”. Conversely, it does result in a situation where the likelihood for fall prices being above current Projected Prices is reduced, lessening the value of the harvest price provision in revenue protection (RP) policies that allows the guaranteed revenue to increase if HPs are above PPs.
The question faced each year at this point on the calendar is: How can one sensibly evaluate their crop insurance options for their own case, reflecting current insurance information, current price expectations, and their own farm’s operating conditions? The University of Illinois farmdoc and farmdoc daily programs provide a suite of on-line tools including a farm-level crop insurance premium calculator, a crop insurance evaluator to compare insurance outcomes, and a price distribution tool that allows a user to recover the market’s estimate of future prices and the likelihood for triggering crop insurance guarantee prices. These tools are available at: https://farmdoc.illinois.edu/crop-insurance.
Additionally, there are several recorded farmdoc daily webinars addressing the 2024 crop insurance and related farm program decisions at: https://farmdocdaily.illinois.edu/webinars?tribe_event_display=past
Evaluating Your Federal Crop Insurance Options
The following materials provide one approach for evaluating the most important crop insurance product and election choices facing corn and soybean producers using the University of Illinois iFARM crop insurance evaluator. The case presented is for McLean County, a large and high yielding county in central Illinois. This case, and similar analyses for approximately 750 other counties throughout 10 states (IL, IN, IA, MI, MN, ND, OH, SD, and WI) largely across the Midwest for both corn and soybeans under both basic and enterprise elections, are available at the farmdoc website in the crop insurance section at: https://fd-tools.ncsa.illinois.edu/evaluator
The tool is free to use as are all the other tools at the site. Importantly, there can be large differences in premiums even over short distances or among contiguous counties, and over the choice of unit structure (i.e. enterprise, optional, or basic) and APH endorsement. Thus, while the case farm information provided for each county is helpful in understanding the relationships among choices, it is important to compare to conditions that most closely match your own case. It is also important to carefully discuss final options and decisions with a qualified insurance agent to ensure accurate information about the specific costs.
The case farm from McLean County, Illinois uses starting price and yield conditions shown in the table below. It is assumed that the case farm qualifies for the Trend Adjusted APH endorsement which takes its average Corn APH from about 203 to 214 bushels per acre. The case shown is for an enterprise Unit on 100 acres (the online version can be selected for any county/crop of interest and toggled across units, and actual acreage).
The county standard deviation of yields is estimated to be about 32.09 bu./acre and the farm yield risk is about 8 bu./acre higher. Some basic risk information is given related to yield risk. There is a 30% chance that the farm yield will be below 195 and a 1 in 10 chance that the farm yield will be below about 160. At the county level (against which Area Plans of insurance are settled) there is a 30% chance of average yields being below 199, 1 in 5 years or 20% likelihood that yields will be less than about 188 and so on.
The average gross revenue (cash basis adjusted) with no insurance is calculated at approximately $900/acre. The gross revenue calculation reflects the negative correlation between the yield and prices, as well as simulated local basis conditions and starting prices. The average futures price is a result of the process used to model the price distribution implied by the options markets for the settlement period and can differ from current futures prices at any point in time, and importantly is connected to the actual futures prices, not the RMA Projected Price. This number updates regularly as market conditions change as well. Consistent with RMA rules, the APH and Trend APH are rounded to nearest whole bushels, and other features of the indemnity calculations are maintained to comply within RMA rules and procedures.
The image below shows a screen shot of the case farm information for McLean County in more detail:
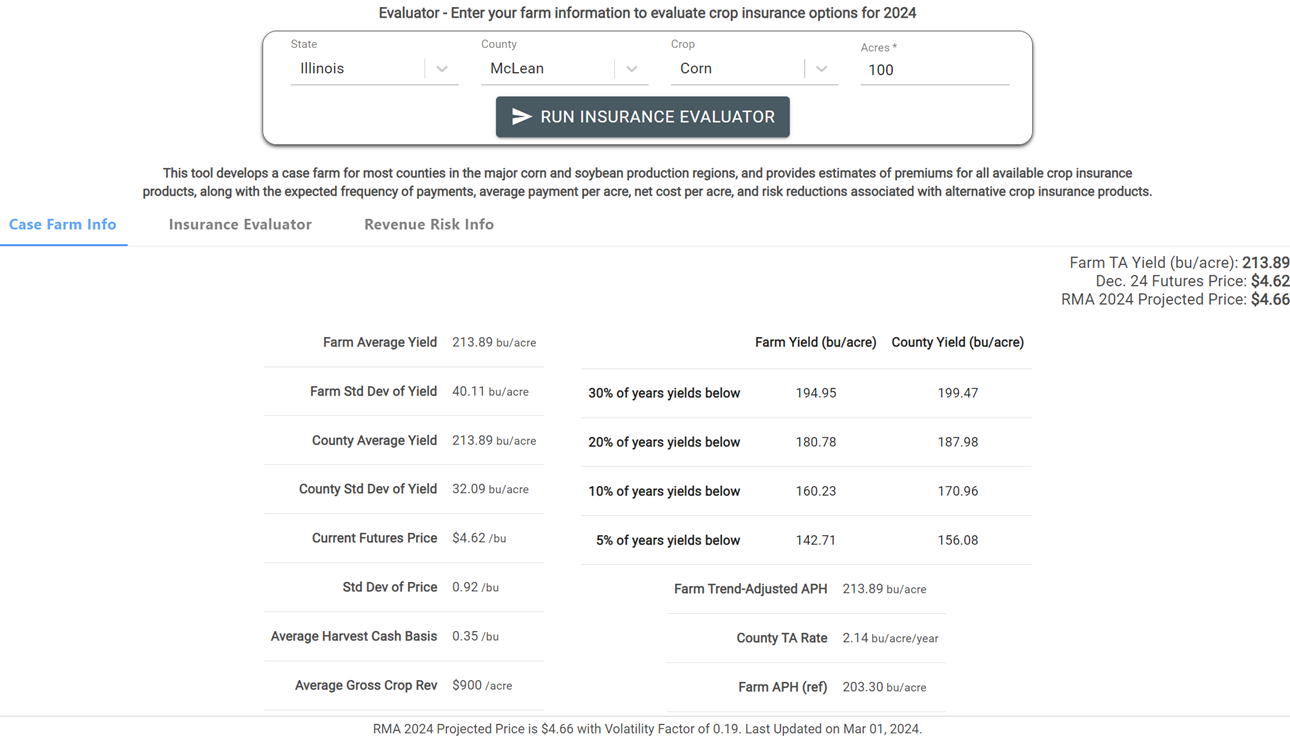
Table 2 shows results from the payment evaluator grouped by type of policy across coverage levels. There are three blocks of results with the left-side collection related to Revenue Protection (RP) policies (by far the most commonly purchased), the center block corresponding to RP-Harvest Price Exclusion or RP-HPE policies, and the right side set for Yield Protection or YP policies. The table has information for each type of policy with each row corresponding to a different coverage level from 50% to 85%. Note that Enterprise Unit policies will cost less than the Basic unit policies shown in Table 2 because of the slightly lower risk represented, and lower premium rates (Enterprise units have the greatest subsidy).
For each insurance policy choice, there are five columns that show:
- the Farmer-Paid Premium per Acre (Est Premium) – gives the costs of the product for a representative case. An 85% RP policy has a $27.31 per acre premium (this cost is much lower than the premium compared to policies a year ago due to lower PPs).
- the Average Payment per acre (Avg Payment) – gives the average expected payment from the insurance product. Over time, indemnity payments from the product will average this value. Some years payments will equal $0, and some years the payments will be higher. The average of all those payments equals $47.01 for an 85% RP policy.
- the Frequency that the policy makes a payment (Payment Frequency) – gives the percent of time the policy will make a payment. For 85% RP policies, the frequency of payments is 35.5%, meaning that this policy will pay slightly more than one-third of the time.
- the Net Cost of insurance – gives estimated premium minus average payments. Over time, this value represents the “cost” of the insurance policy. Negative costs indicate that the policy payments should be expected to exceed the farmer-paid premium. All costs in this column are negative for McLean County – in other words, given the subsidized premium, farmers will make more than they spend through time from crop insurance. The 85% RP policy has a -$19.70 net cost (or $19.70 expected gain) because of the Federal-assistance provided for crop insurance premiums.
Table 2. 2024 Insurance Evaluator – Individual Farm Level Products, McLean County, Illinois
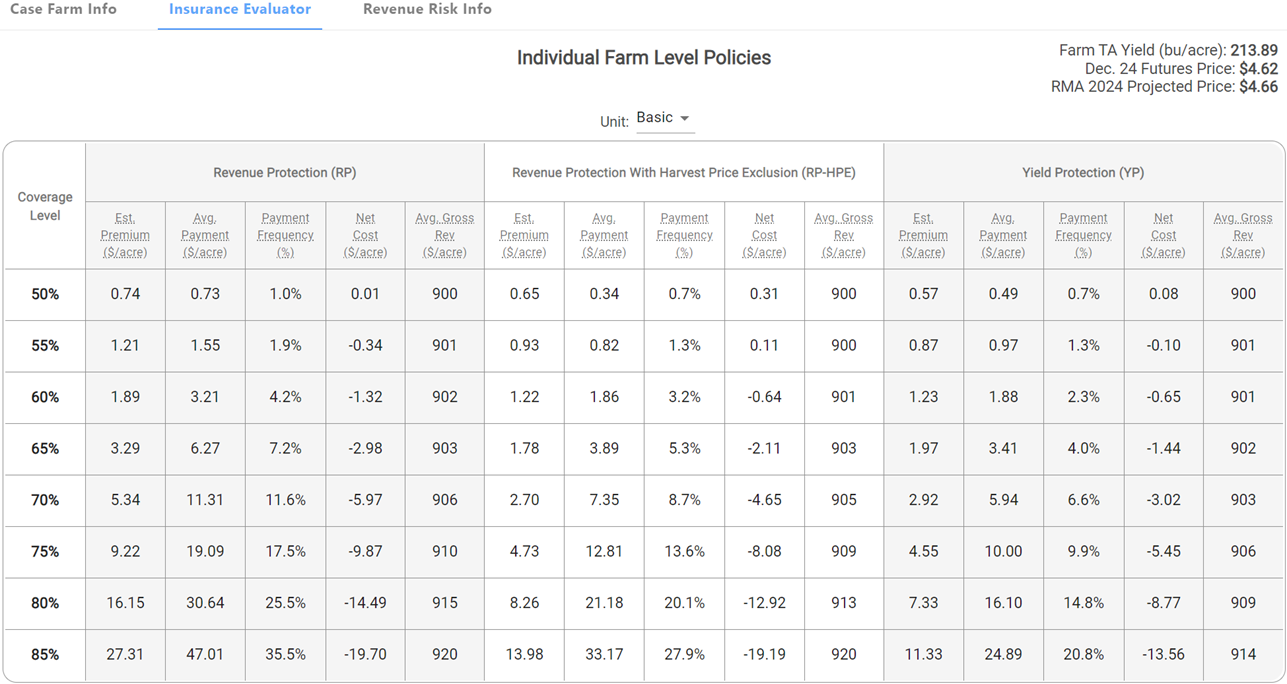
To further understand the items in Table 2, consider 85% coverage policies (bottom row) and note that the base guaranteed revenue is approximately $848/acre (0.85 x $4.66 x 214). The Average Gross Revenue per acre shows the final average revenue outcome with each level and type of insurance, comprised of crop revenue plus insurance proceeds (if any) less premiums. In this case, the Average Gross Revenue with 85% RP equals $920/acre. In other words, the average gross revenue with insurance is improved to that level after crop revenue levels below the insured value are paid back to either the insured level or to a higher level if Harvest Prices increase.
The Net Cost of Insurance is a particularly important feature to understand. Federal crop insurance policies are intended to be rated to pay back all premiums on average. However, they are also subsidized to encourage producer participation, and to account for imprecision in ratings. Thus, on net, they should pay back more than the farmer-paid premium. A negative net cost shows the benefit of insurance directly. In the 85% RP case shown, the policy will actually pay the farmer $19.70 more than the premium cost per year, on average over time, while RP-HPE pays back $19.19 more and YP pays back $13.56 more than the premium cost per year on average.
Under the RP case, if Harvest Prices at the end of the insurance period are higher than $4.66, the guaranteed revenue is adjusted to the higher price. Under RP-HPE policies, the guarantee is fixed and does not increase if the Harvest prices increase. The RP-HPE policy in the center block would have a premium cost of $13.98/acre, and the YP policy (right side block) would be $11.33/acre.
Other rows in Table 2 have comparable information for different coverage levels. As can be seen, scaling back coverage levels can result in substantially lower premiums both because of the lower implied revenue or yield covered, and the lower likelihood of triggering the insurance. The subsidy rate for lower coverage policies is higher than for higher coverage policies with an intent to roughly equalize the dollar value of the subsidy per acre.
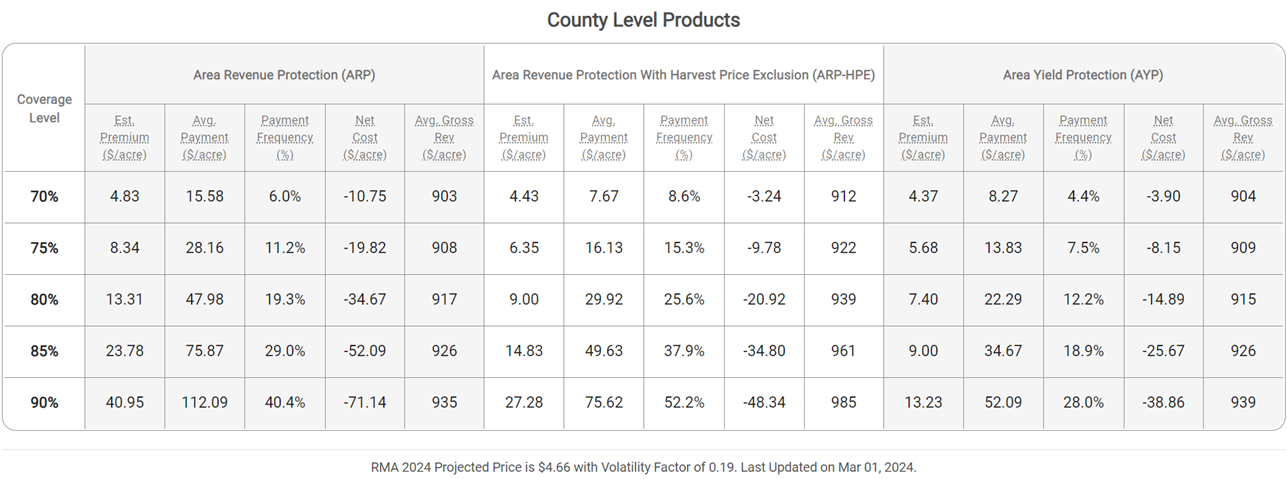
Table 3 shows comparable results, but for County Level or Area products, again for McLean county. These are calculated assuming the maximum elected coverage factors of 1.2 for area products.
The County Level Policies begin with 70% coverage options and range to 90% unlike farm-level policies that have maximums of 85%. The highest coverage Area Risk Protection (ARP) policies also have the highest estimated premiums and average payments due to the protection factor allowing a 1.2 scaling of payments to help offset the farm-to-county basis risk that remains due to imperfect correlation between the farm and the county yields. In other words, the payments may occur when not needed, and not occur in years where they are more needed to offset low on-farm revenues. ARP policies have the highest payments through time, but can result in fairly low risk protection as a result. In the right hand block of Table 3, the Area Yield Protection (AYP) policy is triggered directly by the county yield shortfall from its guaranteed fraction of the county’s expected yield, but paid as a limited fraction of the shortfall. It again shows fairly high payments but can result in limited risk protection because of the possibility of localized yield disruptions, and thus a farm could have very low yields but not receive any payments at all because the county yields were relatively unaffected.
Table 3. 2024 Insurance Evaluator – County Level Products, McLean County, Illinois
While the materials in Tables 2 and 3 above provide a great amount of information about the expected performance of different insurance policies and coverage levels, they focus primarily on the average through time in each case. However, it is also important to understand the impact of insurance on the likelihood of experiencing particularly low revenues. For example, one might be most interested in which insurance allows a farmer to most consistently cover cash rent plus all variable costs, or do the best job of offsetting particularly low revenue outcomes under hedged production, and so on. One way to begin to understand this type of impact is to examine the Revenue Risk and associated revenue levels and their associated probabilities. This type of information is often termed VARs or “Values at Risk” under different insurance contracts. These results are shown in the Revenue risk tab, a screen shot of which is provided below as Table 4 for the McLean county case farm being examined. The results are summarized first in graphical form and also tabulated in terms of the likelihoods of achieving different target revenue levels.
To understand the impact on risk reduction by different insurance policies, the graph tabulates the likelihood of achieving different gross revenue levels (bottom axis) against the probability of occurrence (vertical axis). Because distributions with higher likelihood of higher revenue are preferred, lines to the bottom and right are preferred to those above and to the left in this graph. The blue line provides the possible revenue outcomes with no insurance. The entries above the graph give specific percentile and revenue pairs at the 1%, 5%, 10%, and 25% revenue levels. For example, there is about a 25% chance of revenue with no insurance being below $757 without insurance, and a 5% or 1 in 20 year chance of revenue being below $584/acre with no insurance
Table 4. 2024 Insurance Evaluator – Revenue Risk Results, McLean County, Illinois
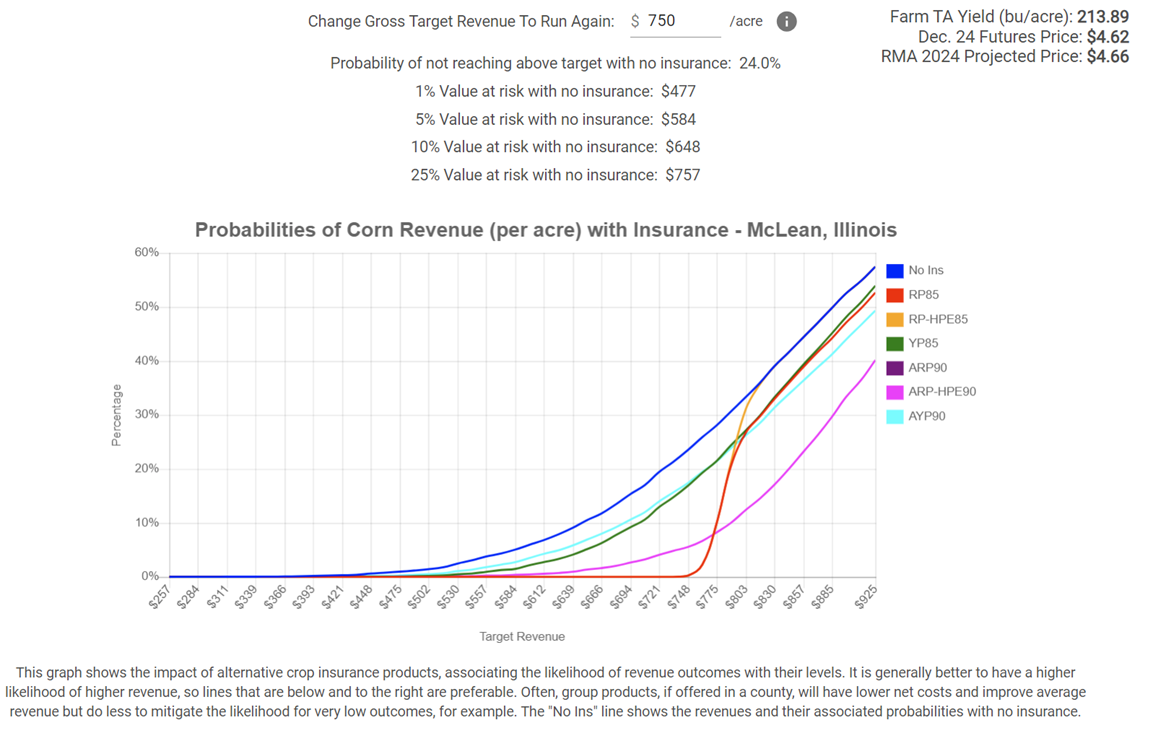
Purchasing insurance has two types of consequences on the revenue distribution — first, it shifts the whole schedule left by the amount of the premium. Then, it adds back payments to outcomes covered by insurance, thereby shifting specific portions of the revenue distribution back to the right. Ideally, insurance should make payments when revenue is lowest and not make payments when revenue is highest resulting in an overall shift in the revenue distribution to the right at lower revenue levels, and resulting in lower revenues when only premiums are paid and no indemnities are paid (top portion of the curves are not shown in the graph, but would be shifted to the left of the no-insurance case). As can be seen in the graph, ARP at a 90% coverage level shifts the distribution to the right by its large average payments, but does little to cut off the severe low revenue outcomes. YP (green) has almost a slight effect compared to no insurance, moving the revenue distribution to the right, but still not cutting off the low revenue tail risk. RP 85% and RP-HPE 85% (largely hidden behind the RP line) do the best job of “cutting off the tail” of the revenue distribution with minimum revenues of roughly $775 or more, guaranteed in most cases. The group products in general are interesting in that they pay back more than premiums over a large range of revenues, but do not protect against particularly severe revenue shortfalls. Further, in years with high crop revenue they actually cost the most in terms of total revenue due to their higher initial premiums.
Similar patterns to these results occur with soybeans, although with more muted cost magnitudes, and in many locations with relatively less valuable Area Protection options. Soybean average gross revenues are also shifted downward relative to last year due to the lower market prices (and given the different economics associated with putting in the crop in terms of break-even targets). The presentation used McLean county for illustration as it is a large county with high production potential and is familiar to many individuals so creates a meaningful base case from which to form other cases. The tool also directly covers the majority of counties in the corn belt as well.
Crop insurance is correctly viewed as providing the cornerstone for active risk management programs, and its importance is elevated in environments with higher input costs, higher commodity costs, and greater price volatility. The differences in underlying rates and starting price and volatility conditions can substantially impact the relative performance of the alternatives from year to year, and across different operations within a given year. The iFARM Crop Insurance Tools are intended to provide producers with insights needed to make informed crop insurance decisions most suitable for their own operations.
Note: The views expressed herein are solely the authors’ opinions and do not necessarily reflect those of entities with whom professionally affiliated. All errors and omissions are the authors’ alone.
Visit the crop insurance tools section of farmdoc on the web at:
https://farmdoc.illinois.edu/crop-insurance
Disclaimer: We request all readers, electronic media and others follow our citation guidelines when re-posting articles from farmdoc daily. Guidelines are available here. The farmdoc daily website falls under University of Illinois copyright and intellectual property rights. For a detailed statement, please see the University of Illinois Copyright Information and Policies here.