


GFAPS Results: Tracking Public Perceptions of the Agri-Food System for Two Years
With the completion of our 8th survey wave in February, the Gardner Food and Agricultural Policy Survey has now completed two years of tracking consumer sentiment on a multitude of food and agricultural policy issues. In Year 2 of the GFAPS, we’ve also reported the public’s perspective on timely issues like how Congress should address the budget deficit (farmdoc daily, May 25, 2023); how extreme weather events affect confidence in the food system (farmdoc daily, September 20, 2023); how inflation impacted holiday meal planning (farmdoc daily, December 14, 2023); and the relationship between firm size and pricing in the agri-food supply chain (farmdoc daily, March 7, 2024).
In this article , we first review the tracking results for consumers’ perceptions of the food system and trust in different food system actors. Second, we discuss tracked measures for when consumers think government should help farmers and what types of assistance are most important. These results provide important perspectives on how these views have changed or remained stable over the last two years.
Methods
The Gardner Food and Agricultural Policy survey is an online, quarterly survey with U.S. consumers. Each quarter, a new panel of approximately 1,000 participants is recruited to participate in the survey. Participants are recruited to match the U.S. population in terms of gender, age, household income, and geographic region. In this post, we utilize results from all eight waves, beginning in May 2022 and ending in February 2024. After 8 waves, we have a total of more than 8,000 responses.
Here, we examine results for four specific questions from the GFAPS. First, we asked participants to what extent they agree/disagree that our food system produces food that is affordable; accessible; tastes good; healthy; sustainable; safe to eat; and provides healthy returns for supply chain actors. Second, we asked participants to rate their level of trust (1=do not trust, 7= trust very much) in five food system actors: farmers, food manufacturers, grocery stores, restaurants, and the government. Third, we asked participants whether they thought the government should provide support to farmers in the following situations: when a natural disaster harms a farmer’s crop; when crop prices are too low; when farmers adopt sustainable production practices; to provide income to farmers; to make crop insurance more affordable for farmers; and when there are agricultural trade or export restrictions. Participants could indicate support for multiple situations, and they could offer alternative situations through an “Other” response category. In the last question, we asked consumer to consider the same situations again but to select the one case when they thought it was most important for the government to provide support to farmers.
Results
Tracking Perceptions of the Food System
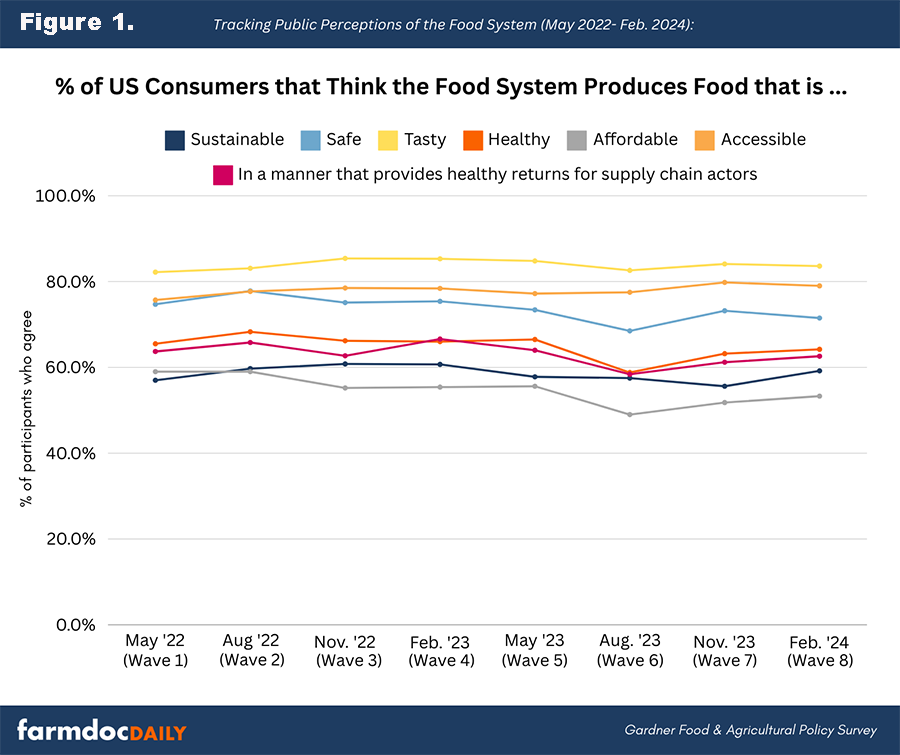
Figure 1 presents consumer perceptions of the food system across the first two years (8 waves) of the GFAPS. From the figure, there are a few key takeaways. First, a large majority of consumers believe the food system produces food that tastes good, is accessible, and is safe to eat. Consumers also generally believe our food system produces food that is healthy, sustainable, and provides healthy returns to supply chain actors, though the level of agreement is not as strong as the top three. Second, perceptions of the food system are relatively stable. While there have been some slight adjustments from wave to wave, there is little change in which perceptions receive the highest (and lowest) levels of agreement. Perceptions of food system affordability have seen the most change over the last two years. The share of consumers agreeing that food is affordable continued to decline for several waves, hitting a low of 49% agreement in Wave 6 (August 2023); however, in our last two waves, consumer outlook on affordability has gradually started to improve.
Tracking Trust in Food System Actors
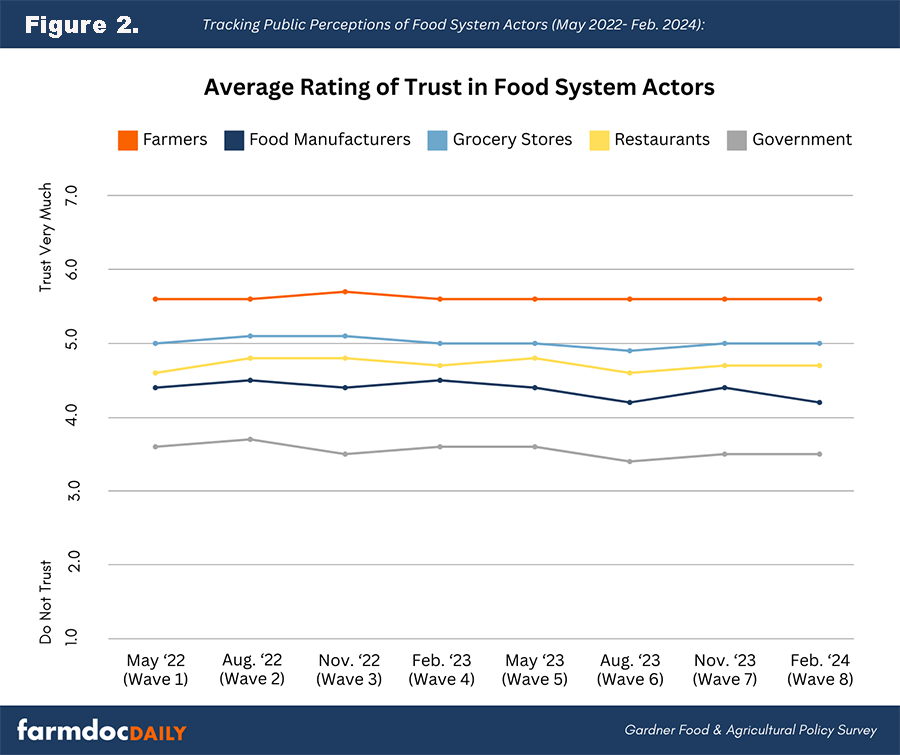
When we look at trust in food system actors (see Figure 2), we find that farmers continue to be the most trusted supply chain actor while the government is the least trusted by consumers. Average trust in farmers, grocery stores, restaurants, and food manufacturers has consistently tracked above the midpoint of the scale, and trust in government has consistently tracked below the midpoint. Trust levels have been very stable over the two-year period.
Tracking Support for Agricultural Payment Types
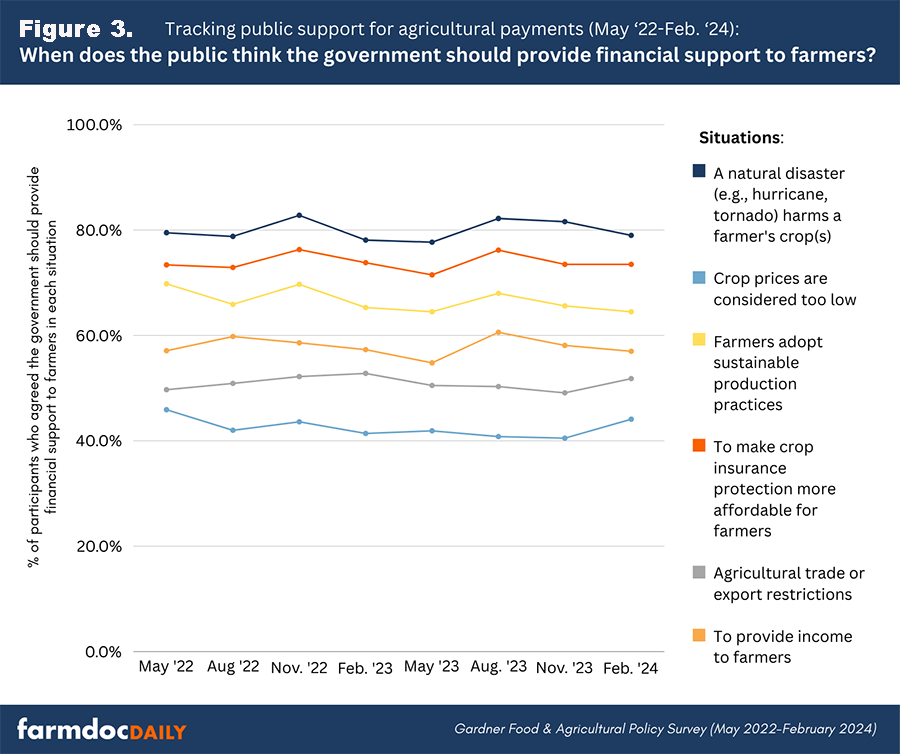
In addition to perceptions of the food system, GFAPS tracks public perceptions of agricultural payments. Figure 3 shows the proportion of consumers who indicated they agreed the government should provide financial support to farmers in each situation. Generally, these results have remained quite consistent. Each wave has found the strongest level of support for farmers after natural disasters harm crops – around 80% in each wave. Similarly, improving crop insurance affordability has consistently received the second highest level of support. Together, this highlights that the most widely supported types of agricultural payments are those that deal with weather-based risks and losses. Notably, a consistent third place has been payments meant to increase adoption of sustainable practices. All three are above 60% support across all 8 waves. Consumers had consistently low levels of support for policies that make payments to farmers when crop prices are considered too low, around 40%.
Tracking Priorities in Agricultural Payment Types
We also track a measure of the public’s priorities for agricultural payments by asking participants in which situation it is most important for the government to support farmers. Figure 4 presents these results across waves. We find that assistance for farmers following natural disasters was consistently the top priority for the public.
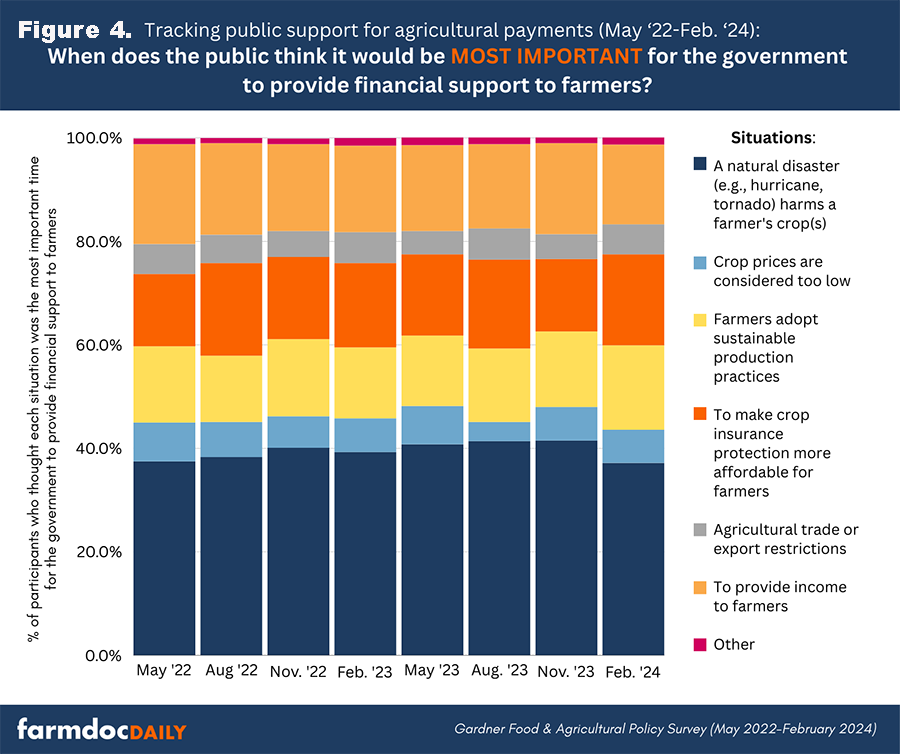
Results from overall support for agricultural payments (Figure 3) and priorities for agricultural payments (Figure 4) generally align; however, there is one notable deviation. The most common priority after assistance for natural disasters was income support for farmers, likely indicating there is a segment of consumers who are supportive of policy aimed at providing a minimum income for farmers.
Conclusions
Two years in, the Gardner Food and Agricultural Policy Survey continues to find that U.S. consumers have generally positive views of the food system and trust the majority of food system actors. Perceptions and trust appear to be relatively stable, even during challenging times (e.g., high inflation, extreme weather events). As both consumers and taxpayers, the public is an important stakeholder in food and agricultural policy. The survey has also found fairly consistent views when it comes to policies that assist farmers. Consumers prefer policies that help in response to natural disasters and they prioritize such payments. In general, the Farm Bill provides support to farmers in three main categories ranked by projected total spending: (1) purchasing crop insurance; (2) for income support (mostly based on low prices); and (3) adopting conservation practices, including those that make farm production more sustainable. From the public’s perspective, assisting with the purchase of crop insurance is generally the second most acceptable reason and the second or third most common priority. Crop insurance indemnifies farmers for losses due to natural disasters, which is the most acceptable reason and the highest priority. Farm programs provide income support (fourth most acceptable; 2nd or 3rd highest priority) to farmers but is mostly in response to low crop prices (least acceptable and least or next-to-least priority). Conservation programs help with many practices for sustainable production, the third most acceptable reason but fourth priority. Using the Gardner Food and Agricultural Policy Survey, we will continue to monitor consumers’ views of the food system going forward and respond to timely issues in the food and agricultural system.
References
Coppess, J., M. Kalaitzandonakes and B. Ellison. "Peering Over the Cliff: Perspectives on Addressing the Federal Budget from the Gardner Food and Agricultural Policy Survey." farmdoc daily (13):96, Department of Agricultural and Consumer Economics, University of Illinois at Urbana-Champaign, May 25, 2023.
Kalaitzandonakes, M., J. Coppess and B. Ellison. "Sizing Up the Food System: US Consumers’ Perceptions of Food System Firm Sizes and Pricing." farmdoc daily (14):47, Department of Agricultural and Consumer Economics, University of Illinois at Urbana-Champaign, March 7, 2024.
Kalaitzandonakes, M., J. Coppess and B. Ellison. "Eat, Drink, and Be Merry? How US Consumers Expect Inflation to Impact their Holiday Meals." farmdoc daily (13):227, Department of Agricultural and Consumer Economics, University of Illinois at Urbana-Champaign, December 14, 2023.
Kalaitzandonakes, M., J. Coppess and B. Ellison. "Extreme Weather and the Food System." farmdoc daily (13):171, Department of Agricultural and Consumer Economics, University of Illinois at Urbana-Champaign, September 20, 2023.
Disclaimer: We request all readers, electronic media and others follow our citation guidelines when re-posting articles from farmdoc daily. Guidelines are available here. The farmdoc daily website falls under University of Illinois copyright and intellectual property rights. For a detailed statement, please see the University of Illinois Copyright Information and Policies here.