


Liquidity Trends for Illinois Farms: Comparing Farms by Gross Farm Returns from 2003-2022
This article concludes our series on the liquidity of Illinois grain farms. In our previous article (farmdoc daily March 13, 2024), we examined the current ratio trends of grain farms in Illinois at both statewide and regional levels. We found that there has been a substantial improvement in liquidity over the last two decades. However, we also observed regional differences in liquidity. We now consider how the size of gross farm returns[1] relates to the liquidity of Illinois grain farms using data obtained from the Illinois Farm Business Farm Management (FBFM). We define small farms as those with gross farm returns less than $350,000, medium-sized farms as those with returns between $350,000 and $999,999, and large farms as those with returns greater than $999,999.
In our analysis, we report the annual average current assets and current liabilities of grain farms in Illinois by the size of their gross farm returns—small, medium-sized, and large. We then use these values to calculate the implied current ratio (hereafter, current ratio). This approach will also allow us to discuss the relative changes in current assets and current liabilities driving the current ratio trends. The current ratio is a measure of liquidity that assesses a farm’s ability to meet its short-term financial obligations as they become due. It is calculated by dividing the value of a farm’s current assets[2] by its current liabilities[3]. In other words, it measures a farm’s ability to pay off its short-term liabilities with its short-term assets. According to the Farm Financial Scorecard[4] developed by the Center for Farm Financial Management, a farm with a current ratio that is less than 1.3 is categorized as vulnerable, a ratio between 1.3 and 2.0 is categorized as cautionary, and a ratio that is greater than 2.0 is categorized as strong. Therefore, the higher the current ratio, the more liquid the farm is. Lastly, in our figure below, we use the color-coding system of the Farm Financial Scorecard to indicate the category under which the average farm’s current ratio belongs. The region shaded in red indicates a vulnerable ratio, while yellow indicates a cautionary ratio, and green indicates a strong ratio.
Are larger grain farms in Illinois more liquid?
Figure 1 shows the average current assets, liabilities, and current ratio of Illinois grain farms, categorized by the size of their gross farm returns. Over the past two decades, grain farms with higher gross farm returns have been less liquid, on average, than those with lower gross farm returns. In 2003, the current ratio of small farms was 1.90 (cautionary), compared to medium-sized and large farms, which had a current ratio of 1.56 (cautionary) and 1.01 (vulnerable), respectively. At that time, small farms had $199,078 in average current assets and $104,872 in average current liabilities, whereas medium-sized farms had $433,022 in average current assets and $277,624 in average current liabilities, and large farms had $821,227 in average current assets and $813,160 in average current liabilities.
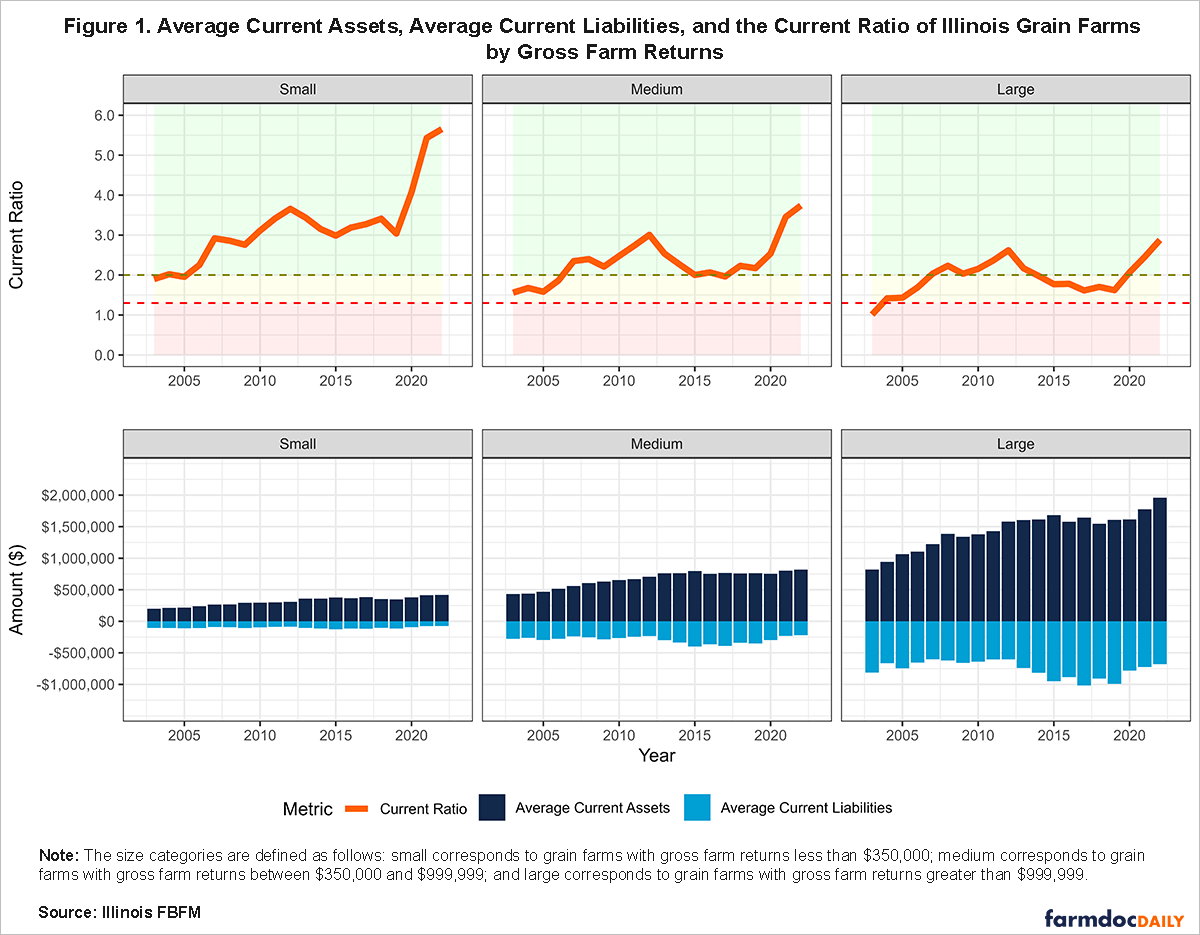
The current ratio of small farms increased by 53.83% from 2003 to 2007, rising from 1.90 (cautionary) to 2.92 (strong). Similarly, the current ratio of medium-sized farms increased by 50.58% in the same period, rising from 1.56 (cautionary) to 2.35 (strong). Although large farms were in the vulnerable range in 2003, they managed to increase their current ratio by 101.56%, reaching a ratio of 2.04 (strong) by 2007. Interestingly, small and medium-sized farms experienced similar percentage changes in their average current assets and liabilities during that period, with average current assets increasing by 33.40% and 29.18%, and average current liabilities decreasing by 13.28% and 14.21%, respectively. In contrast, the average current assets of large farms increased by 49.05%, while their average current liabilities decreased by 26.05%, resulting in a significant improvement in their current ratio and liquidity.
There was a further improvement in liquidity for all farm sizes from 2007 to 2012. This improvement occurred during a period when grain prices rose substantially. For example, the federal mandate set in 2005 and 2007 to increase ethanol production in the U.S. contributed to an increased demand for corn. Higher prices led to higher ending inventory, thus increasing current assets. These higher prices also increased net farm incomes, resulting in a lesser need for farm operating loans. The current ratio of small farms increased by 25.25%, rising from 2.92 (strong) to 3.66 (strong). Similarly, medium-sized farms increased their current ratio by 27.98%, from 2.35 (strong) to 3.01 (strong). In comparison, the current ratio of large farms increased by 28.76%, from 2.04 (strong) to 2.62 (strong). During this period, small farms increased their average current assets by 16.45%, from $265,577 to $309,266. Whereas medium-sized and large farms experienced greater percentage changes in their average current assets, increasing by 26.13% from $559,359 to $705,516 and 29.13% from $1,224,071 to $1,580,662, respectively. However, small farms had the largest percentage change in average current liabilities during this period, decreasing by 7.03% from $90,946 to $84,555. Medium-sized farms experienced a modest decrease in average current liabilities, only falling by 1.44% from $238,162 to $234,721. Conversely, the average current liabilities of large farms slightly increased by 0.29%, rising from $601,343 to $603,100.
Thereafter, the liquidity of grain farms of all sizes decreased from 2012 to 2019. Grain farms with higher gross farm returns experienced larger declines in their current ratio. Grain prices and farm incomes also declined during this period. The current ratio of small farms fell by 16.93% from 3.66 (strong) to 3.04 (strong), compared to a decline of 27.71% from 3.01 (strong) to 2.17 (strong) for medium-sized farms, and an even larger decline of 38.15% from 2.62 (strong) to 1.62 (cautionary) for large farms. These declines can be explained by the average current liabilities of these grain farms growing much faster than their average current assets. For example, the average current assets of small farms increased by 12.60%, while their average current liabilities increased by 35.56%. However, medium-sized and large farms increased their average current assets by 8.06% and 1.73% but increased their average current liabilities by 49.48% and 64.49%, respectively, during this period.
The liquidity of these farms has since improved from that period. Grain prices rose sharply shortly after the start of the COVID-19 pandemic as a result of trade-related disruptions along with rising energy and fertilizer costs. These high grain prices led to record-breaking accrual net farm incomes for Illinois grain farms in 2021 and 2022. From 2019 to 2022, small farms increased their current ratio from 3.04 (strong) to 5.65 (strong), an 86.04% increase. This was due to their average current assets increasing by 20.47% from $348,246 to $419,547, and their average current liabilities declining by 35.24% from $114,623 to $74,226. On the other hand, the current ratio of medium-sized farms increased by 72.10% during this period, rising from 2.17 (strong) to 3.74 (strong). Their average current assets only increased by 7.53% from $762,346 to $819,768, but their average current liabilities decreased by 37.52% from $350,865 to $219,235. The current ratio of large farms increased by 77.60% from 1.62 (cautionary) to 2.88 (strong), with their average current assets increasing by 21.81% from $1,608,007 to $1,958,734, and their average current liabilities declining by 31.41% from $992,016 to $680,396.
Conclusion
The liquidity of Illinois grain farms has shown significant improvement over the past two decades. However, when we consider the size of gross farm returns, we observe distinct differences in the quality of liquidity. Overall, grain farms with higher gross farm returns are less liquid, on average, than those with lower returns. As of 2022, the current ratio of the average small grain farm was 5.65 (strong), while the average medium-sized grain farm had a ratio of 3.74 (strong), and the average large grain farm had a ratio of 2.88 (strong). Even though a strong current ratio indicates that a farm can comfortably generate sufficient cash to meet its short-term obligations, there is a tradeoff in having a high current ratio, such as the 2022 current ratio for small grain farms. This is because it may suggest an inefficient use of working capital since some of the cash could have been invested in longer-term assets that could potentially generate higher returns for the farm operation in the future. In addition, some smaller producers may have a full-time job off the farm that allows them to provide additional cash and benefits to their families while maintaining a small operation. Even though all of the different-sized farms saw an improvement in their current ratios over time, especially in 2022, careful monitoring of this liquidity measure is needed as we move into the 2024 growing season, where income projections are expected to be lower for the year.
Acknowledgment
The authors would like to acknowledge that data used in this study comes from the Illinois Farm Business Farm Management (FBFM) Association. Without Illinois FBFM, information as comprehensive and accurate as this would not be available for educational purposes. FBFM, which consists of 5,000+ farmers and 70 professional field staff, is a not-for-profit organization available to all farm operators in Illinois. FBFM field staff provide on-farm counsel along with recordkeeping, farm financial management, business entity planning and income tax management. For more information, please contact our office located on the campus of the University of Illinois in the Department of Agricultural and Consumer Economics at 217-333-8346 or visit the FBFM website at www.fbfm.org.
Notes
[1] Gross farm returns are defined here as the sum of crop sales, livestock and livestock product sales, government payments, settlements, other farm receipts, and the net change in accounts receivable, less purchased feed and grain, and purchased livestock.
[2] Current assets consist of assets that are expected to be converted into cash within one year.
[3] Current liabilities consist of obligations that are due within one year.
[4] The Farm Financial Scorecard adheres to the guidelines set by the Farm Financial Standards Council.
References
Mashange, G. and Zwilling, B. "Liquidity Trends for Illinois Farms: A Regional Comparison of Current Ratios from 2003-2022." farmdoc daily (14):51, Department of Agricultural and Consumer Economics, University of Illinois at Urbana-Champaign, March 13, 2024.
U.S. Department of Agriculture, Economic Research Service. (2024, February 7). Farm Sector Income & Finances: Highlights from the Farm Income Forecast.
Disclaimer: We request all readers, electronic media and others follow our citation guidelines when re-posting articles from farmdoc daily. Guidelines are available here. The farmdoc daily website falls under University of Illinois copyright and intellectual property rights. For a detailed statement, please see the University of Illinois Copyright Information and Policies here.