


US Inflation and Interest Rates
In response to higher inflation, the Federal Reserve has raised the effective Federal Funds interest rate from 0.08% in January 2022 to 5.3% currently. It is now higher relative to current inflation than its historical average over the last 60 plus years. In contrast, market interest rates relative to inflation are lower than history suggests. The latter is consistent with the market’s view that post-2020 inflation is temporary. If the market’s view is correct, the Federal Reserve will begin to cut interest rates but market rates will likely decline less than the Federal Funds rate. If the market’s view is incorrect, market interest rates will need to move higher if inflation remains at or increases above its current level. The data in this article come from the Federal Reserve Economic Data files (FRED) maintained by the Federal Reserve Bank of St. Louis.
Price Inflation:
Several measures of price inflation exist. The most commonly watched is the Consumer Price Index (CPI). However, economists consider the GDP (Gross Domestic Product) implicit price deflator index the most complete measure of prices in an economy. Since1962, annual consumer price inflation has usually exceeded the GDP deflator’s more complete measure of inflation (see Figure 1). Since 1962, annual CPI and GDP deflator inflation have averaged 3.8% and 3.4%, respectively. During the first quarter of 2024, annual CPI inflation was 3.3% and GDP deflator inflation was 3.1%. The two measures closely track one another. Their correlation is +0.96 (+1.0 is perfect positive correlation).
 Inflation and Interest Rates:
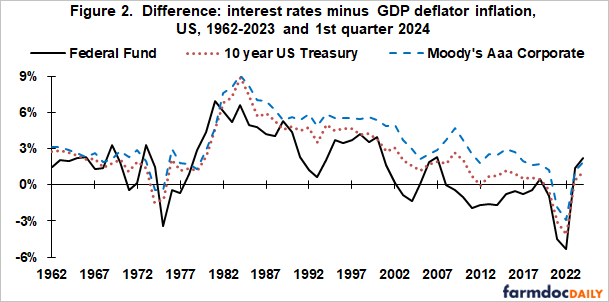
The Federal Reserve has the most control over the Federal Funds interest rate. A key relationship is its difference from the inflation rate. The Federal Funds rate has averaged 1.5 percentage points higher than GDP deflator inflation since 1962 (4.9% vs. 3.4%) (see Figure 2). During the first quarter of 2024, the difference was 2.2 percentage points (5.3% vs. 3.1%), or 0.7 percentage points above the historical average difference.
Differences between market interest rates and inflation are also of interest. Two widely watched market interest rates are the 10-year US Treasury Bond and Moody’s Aaa Corporate index rate. Since 1962, the first year for which FRED reports 10-year US Treasury bond rates; these two market interest rates have respectively averaged 2.5 and 3.5 percentage points higher than GDP deflator inflation (5.8% and 6.9% vs. 3.4%) (see Figure 2). During the first quarter of 2024, the differences were notably smaller at 1.1 and 1.9 percentage points, respectively.
 Market’s Expected Inflation:
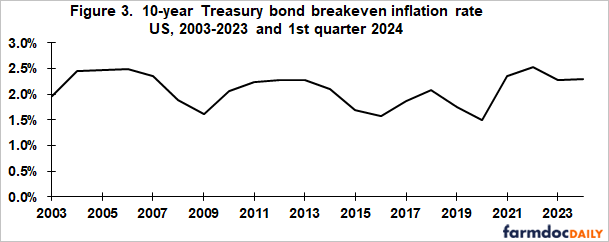
FRED publishes a market estimate of expected average inflation over the next 10 years. It is derived from the 10-year Treasury constant maturity bond and 10-year Treasury inflation-indexed constant maturity bond. It is first available for 2003. Over 2003-2023, this measure of expected 10-year inflation averaged 2.1% (see Figure 3). During the first quarter of 2024, it was slightly higher at 2.3%. The implication is that the market most likely views post 2020 inflation as temporary.
 Discussion
The current relationships of the Federal Funds and market interest rates relative to inflation differ from their historical relationships.
The 10-year Treasury Bond and Moody’s Aaa corporate interest rates have a narrower-than-normal premium to inflation. Market interest rates are thus currently lower than history suggests they should be given recent US inflation. This relationship is consistent with current market assessment that the post-2020 inflation event is mostly, if not totally, transitory.
In contrast, the Federal Funds rate, the interest rate the Federal Reserve most directly controls, has a higher premium to inflation than its historical average premium. This relationship is consistent with comments from the Federal Reserve of its concern with how permanent post-2020 inflation may be.
These two different views will likely converge sometime in the future. If the market’s view of temporary post-2020 inflation is wrong, market interest rates will need to move higher. If the market’s view is correct, the Federal Reserve will begin to cut interest rates but market rates will likely fall less than the Federal Funds rate.
In thinking about future timelines, it is interesting to compare, so far, the current inflation event with the inflation event of the 1970s. Following the higher oil price shock of 1973 (Corbett), the Federal Funds rate was below the inflation rate for three years (1975, 1976, and 1977) (see Figure 2). Following the COVID lockdown, the Federal Funds rate was below the inflation rate for three years (2020, 2021, and 2022). During the 1970s, the Federal Funds rate moved progressively higher than the inflation rate for four years (1978, 1979, 1980, and 1981) before starting to decline both in terms of its level and relative to inflation as inflation also began to decline. It is inappropriate at present to argue that these two inflation events will take similar paths, but the 1970s inflation path is a caution flag that the Federal Funds rate could possibly remain high both in terms of its level and relative to inflation for several more years.
References
Corbett, M. November 22, 2013. Oil Shock of 1973-74, October 1973-January 1974. Federal Reserve Bank of Boston. https://www.federalreservehistory.org/essays/oil-shock-of-1973-74#:~:text=October%201973%E2%80%93January%201974,environment%20of%20the%20early%201970s.
Federal Reserve Bank of St. Louis. May 2024. Federal Reserve Economic Data (FRED). https://fred.stlouisfed.org
Disclaimer: We request all readers, electronic media and others follow our citation guidelines when re-posting articles from farmdoc daily. Guidelines are available here. The farmdoc daily website falls under University of Illinois copyright and intellectual property rights. For a detailed statement, please see the University of Illinois Copyright Information and Policies here.