


Crop Insurance and Statutory Reference Prices
Federal crop insurance is a farm payment program since farmers pay on average only about 38% of the total actuarially-fair premium. Not considering the resulting net insurance indemnity payments to farmers when setting statutory reference prices means reference prices could exceed the total economic cost of production. Among other problems, this could potentially put upward pressure on farm input prices and stimulate production. For seed cotton and rice, their 2024 statutory reference price exceeds their 2024 total economic cost of production per unit of trendline yield when average net crop insurance payments for the 2014-2023 crops are taken into account. In an earlier article, we pointed out that reference prices proposed by the House Agriculture Committee would exceed 2024 cost of production even without taking indemnity payments into account for peanuts, long grain rice and seed cotton.
Net Crop Insurance Indemnity per Insured Acre
An individual farmer may or may not receive more payments from crop insurance than the premium paid by the farmer, but as a group producers of the eight crops in Figure 1 received more insurance payments than premiums they paid for the 2014-2023 crops. The range of average net positive indemnity per insured acre was $88 for seed cotton to $6 for soybeans (see Figure 1). Net indemnities are positive for insured farmers as a group because on average they pay only about 38% of the total actuarially fair premium.
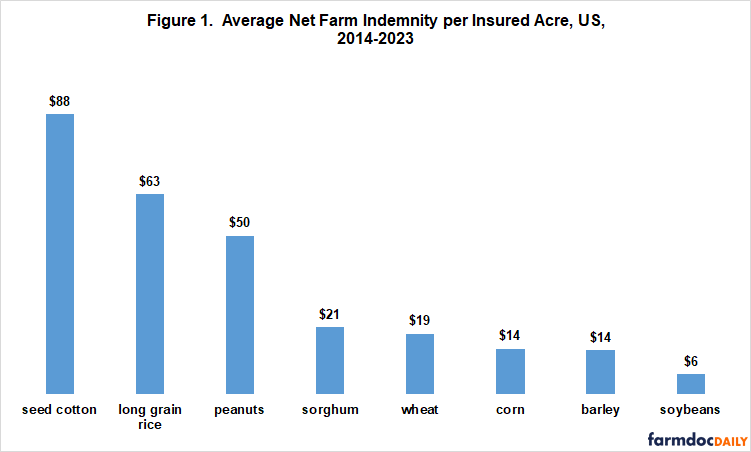
For each crop in Figure 1, harvested US acres exceed one million annually and USDA, ERS (US Department of Agriculture, Economic Research Service) reports a total economic cost of production, which is used in this analysis. Net indemnity equals ((total indemnity paid by crop insurance minus total premium paid by farmers) divided by total insured acres). The data are from USDA, RMA (Risk Management Agency) Summary of Business.
RMA’s last major ratings review was implemented in 2011. The current set of individual farm insurance products was first offered for the crops in this study during the 2011 crop year, except for peanuts. Peanuts’ first year was 2015. Given these considerations, we choose the 2014-2023 crop years as the period over which to calculate average net farm indemnity per insured acre. This 10-year period is assumed to be a good indicator of future net indemnity payments. See Data Note 1 for a brief discussion on net indemnities for the longer 2011-2023 period.
Net Indemnity Relative to Cost of Production
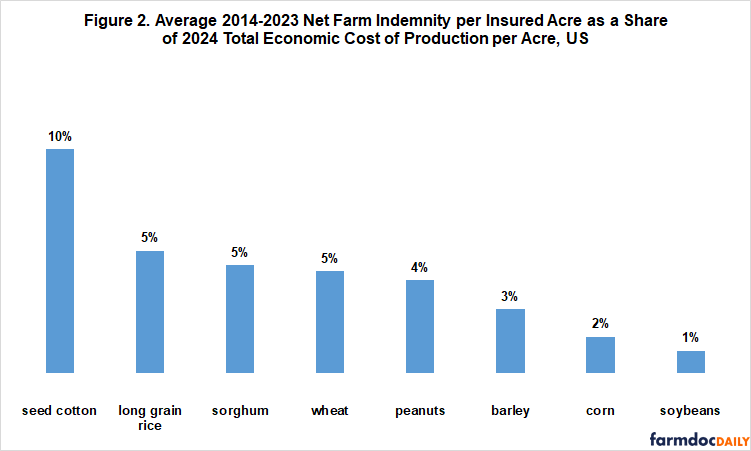
Because economic cost of production varies by crop, the average net farm indemnity per insured acre for 2014-2023 is also expressed as a share of the current estimate for the 2024 total economic cost of production. The share ranged from 10% for seed cotton to 1% for soybeans (see Figure 2).
Share of Acres Insured
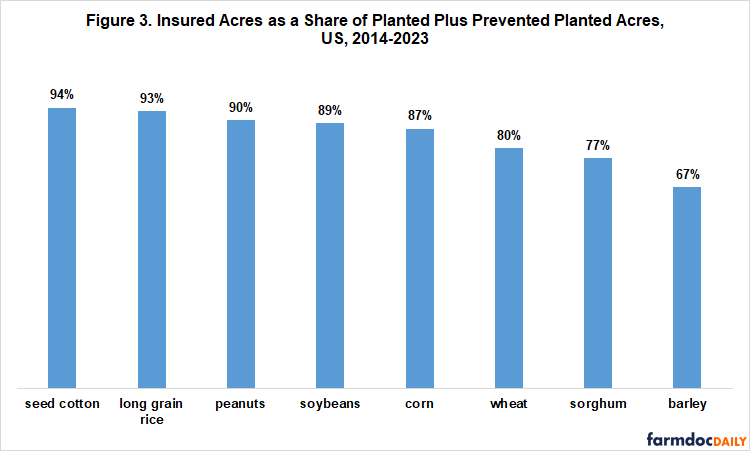
Not every planted acre is insured. Given available public data, it is not clear how to measure market penetration of crop insurance, but an often computed measure is the ratio of primary insured acres reported by USDA, RMA to the sum of planted acres reported by USDA, NASS (National Agricultural Statistics Service) plus acres prevented from being planted reported by USDA, FSA (Farm Service Agency). Over 2014-2023, this share was at least 77% for seven of the eight crops and 90% for seed cotton, long grain rice, and peanuts (see Figure 3). Except possibly for barley, the share implies the great majority of acres planted to these crops over 2014-2023 were eligible for crop insurance payments. Note, sorghum insured acres is the sum of insured acres for grain sorghum and silage sorghum.
2024 Statutory Reference Prices vs. 2024 Economic Cost of Production
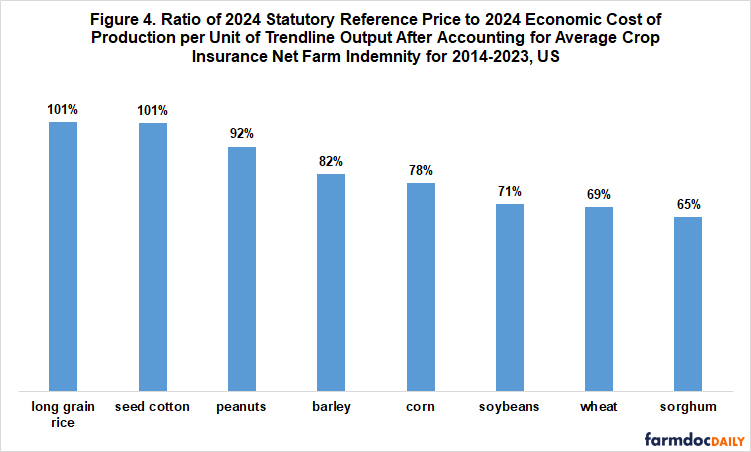
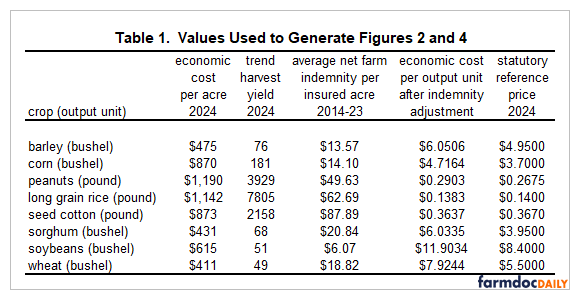
The ratio of statutory reference price (from USDA, FSA) to total economic cost per trend output unit is an indicator of relative public support provided to a crop. The higher the ratio, the greater the support. The ratio is calculated for each crop using their 2024 statutory reference price, 2024 trendline yield, and 2024 economic cost of production after subtracting the crop’s average 2014-2023 net farm indemnity per insured acre. This ratio varies from 101% for long grain rice and seed cotton to 65% for sorghum (see Figure 4). Cost of production and trendline yield are discussed in Data Note 2. The values used to create Figures 2 and 4 are in Table 1 following this data note.
Discussion
Over the last ten crop years, net crop insurance payments per insured acre varied by a factor of 10 times across program crops even when expressed relative to total economic cost of production.
Not taking net crop insurance payments into account raises the possibility that the farm safety net of crop insurance and commodity programs may support more than the economic cost of producing a crop, thus potentially putting upon upward pressure on production costs and stimulating production.
When average net crop insurance indemnities over the last 10 years are taken into account, the 2024 crop year statutory reference prices for long grain rice and seed cotton exceed their 2024 total economic cost per unit of trend yield output.
Data Note 1
The largest change in net indemnity per insured acre when using the longer 2011-2023 period was for corn. Its average net indemnity increased from $14 to $26 per insured acre. Corn’s average net farm indemnity per insured acre as a share of 2024 total economic cost of production per acre increased from 2% to 3%, and the ratio of 2024 statutory reference price to 2024 economic cost of production per unit of trendline output after accounting for average crop insurance net farm indemnity increased from 78% to 80%. Average net indemnity per insured acre decreased for long-grain rice from $63 to $58 but increased for seed cotton from $88 to $91.
Data Note 2
USDA, ERS reports an economic cost to produce the eight program crops examined in this study. The economic cost includes operating costs, such as seed and fertilizer; allocated overhead costs, such as equipment, taxes, and insurance; and an opportunity cost assigned by ERS to unpaid labor and farmer-owned land. The only input not assigned a cost is management. Quantity of each input is based on periodic surveys of farms. Price of each input is updated annually using USDA, NASS data. We think ERS costs are reasonable estimates of the cost to produce a crop in the US, but encourage readers to examine the extended discussion of ERS cost estimates in Zulauf, Langemeier, and Schnitkey (2020) and form their own opinion.
Economic cost for 2024 is a preliminary estimate. It is available only for the US and is an average for all types of a crop. The cost for long grain rice is derived using the US all rice cost for 2024 ($1,259.20/acre) times 90.7%, the ratio of average per acre cost for Arkansas non-Delta, Gulf Coast, and Mississippi River Delta regions to the US all rice average per acre cost for the 2023 crop. In general, long grain is produced in the US except for California, which mostly produces temperate-Japonica rice and is the fourth region for which USDA, ERS reports a cost of production.
Trend yield per harvested acre is estimated using harvested yields reported in USDA, NASS Quick Stats. Change in yield over time is similar for harvested and planted acres. A linear time trend over the 1974-2023 crop years explained the following share of year-to-year variation in US yield per harvested acre by crop: barley (80%); corn (87%), seed cotton (71%), peanuts (71%), long grain rice (95%), sorghum (13%), soybeans (89%), and wheat (81%).
References and Data Sources
US Department of Agriculture, Economic Research Service. May 2024. Cost of Production. https://www.ers.usda.gov/data-products/commodity-costs-and-returns/
U.S. Department of Agriculture, Farm Service Agency. July 2024. ARC/PLC Program Data. https://www.fsa.usda.gov/programs-and-services/arcplc_program/arcplc-program-data/index
US Department of Agriculture, National Agricultural Statistics Service. July 2024. Quick Stats. https://quickstats.nass.usda.gov/
Zulauf, C., M. Langemeier, and G. Schnitkey. 2022. U.S. Crop Profitability and Farm Safety Net Payments since 1975. Journal of the American Society of Farm Managers and Rural Appraisers. Pages 60-69. https://www.asfmra.org/resources/asfmra-journal
Zulauf, C., G. Schnitkey, J. Coppess and N. Paulson. “Are Changes in Cost of Production and Statutory Reference Prices Related in the House Agriculture Committee 2024 Farm Bill?” farmdoc daily (14):101, Department of Agricultural and Consumer Economics, University of Illinois at Urbana-Champaign, May 29, 2024.
Disclaimer: We request all readers, electronic media and others follow our citation guidelines when re-posting articles from farmdoc daily. Guidelines are available here. The farmdoc daily website falls under University of Illinois copyright and intellectual property rights. For a detailed statement, please see the University of Illinois Copyright Information and Policies here.