Inflation and Conservation, Part 2: When is Inflation “Not Just” Inflation?
As farm incomes tumble from the 2022 peak, and all-time record levels, talk of recession ripples through farm country; harvest-time concerns become amplified by a survey of agricultural economists, half of whom responded that they think the farm economy is already there (McCullough, October 23, 2024; NAFB News Service, October 23, 2024; Farm Policy News, October 22, 2024; Morgan, October 21, 2024; Lotts, September 30, 2024; Peters, September 9, 2024; USDA-ERS, September 5, 2024). Much of the catalyst is the recent decrease in crop prices, pushed down by expectations for a large harvest and colliding with a continuation of high costs for the inputs needed to produce next year’s crop (farmdoc daily, October 8, 2024; September 24, 2024; September 17, 2024; September 10, 2024). The situation also revives discussions about the cost squeeze challenge for farmers (farmdoc daily, September 26, 2024). As previously noted, however, all the talk of inflationary and cost challenges for farmers ignores the implications for the costs of conservation (farmdoc daily, May 23, 2024). This article follows up on the previous discussion for added perspective on the potential impacts high costs can have for those farmers seeking to adopt conservation practices such as cover crops.
Background
As before, we use the Environmental Quality Incentives Program (EQIP) to explore questions about conservation and inflation. EQIP provides financial assistance to farmers in return for adopting specific conservation practices in their fields (see e.g., USDA-NRCS, EQIP; Stubbs, March 20, 2023; Stubbs, May 3, 2019; farmdoc daily, April 13, 2023). In the statute, Congress has authorized financial assistance up to 75 percent “of the costs associated with planning, design, materials, equipment, installation, labor, management, maintenance, or training,” as well as 100 percent of the “income forgone by the producer” or a combination of the two (16 U.S.C. 3839aa-2). For purposes of this analysis, EQIP is useful because the reimbursements are determined annually by NRCS using expected incurred farm input cost estimates (USDA-NRCS, Payment Schedules). A first question is whether the cost estimates keep up with actual costs under inflationary conditions as have been experienced since the pandemic.
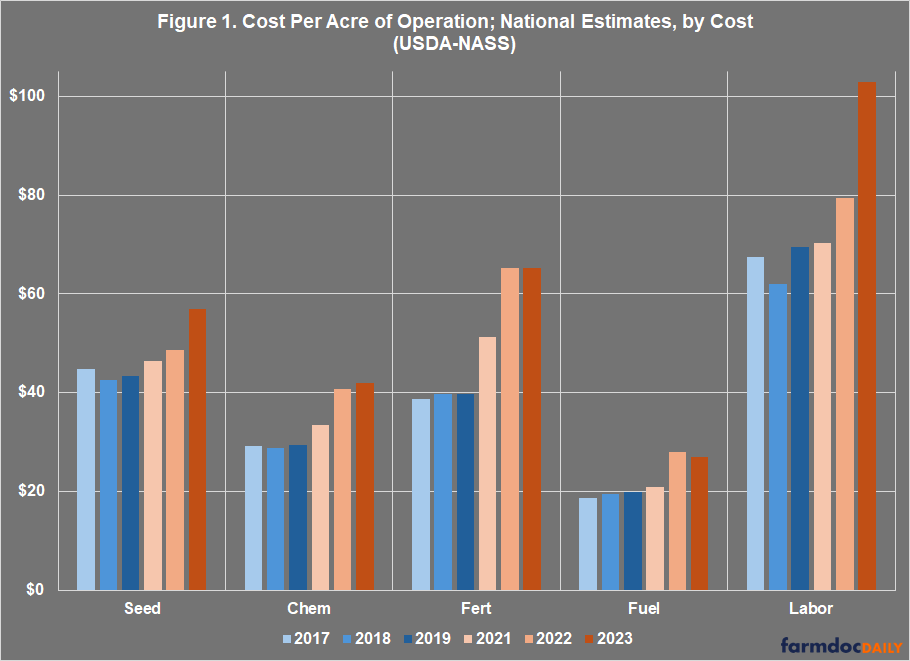
Throughout each year, NASS conducts quarterly surveys on prices paid for production inputs, as well as asking farmers about their landholdings and operational costs (USDA-NASS: “The Estimating Programs – Prices, Costs, and Returns;” “Surveys;” and “Publications”). For the discussion in this article, we used dollar-per-operation costs from NASS Quickstats to estimate how dollars spent vary across cost components for an average farming operation in each state. We used NASS survey data to divide the dollar-per-operation state averages by the average area operated per farm operation (measured in acres). The result is a “cost per acre of operation” estimate for each state; only states with data in all 6 years (2017-2019 and 2021-2023) were used. Figure 1 illustrates the costs per acre of operation for each of the major input costs, by pre-pandemic and post-pandemic year groupings.
Discussion
For this discussion, we again use the “group 1/group 2” methodology to compare cost averages for the pre-pandemic years (2017 to 2019) with the post-pandemic years (2021 to 2023) as indicated in Figure 1. By this comparison, the key input costs (seed, chemical, fertilizer, fuel, and labor) grew by 23% between the pre- and post-inflationary periods. This roughly matches the federal inflation rate. There is significant variability, however.
To better understand how farm input costs have changed compared to inflation, we next calculated the average change from “group 1” years (2017 to 2019) to “group 2” years (2021-2023) for the specific farm input costs. We divided this by a benchmark rate of inflation implied by the Consumer Price Index (CPI), which is calculated by the Bureau of Labor Statistics (BLS) and as reported by the Federal Reserve Bank of Minneapolis (Minneapolis Fed). These calculations were completed for each input/region combination and the results are reported in Figure 2. Numbers below “1” mean that the cost component for that region grew below the benchmark inflation rate, whereas numbers above “1” mean that costs grew at a rate outstripping the benchmark. For example: Fertilizer costs in the Eastern Uplands grew at approximately 85% of the inflation rate between 2017-2023. Fertilizer cost growth in the Heartland, however, more than doubled the rate of inflation (2.78 times the rate of inflation), while seed costs grew at less than the rate of inflation across all regions.
The regional variations in Figure 2 raise questions for further exploration, including those about regional differences in yields and whether that impacts the variations in costs. Such questions likely begin with any correlation with the growth in chemical and fertilizer expenditures relative to inflation. The focus of this discussion is to apply this initial analysis to highlight potential issues with conservation policy that result from inflation using EQIP expected cost reimbursements as an initial test case. EQIP program guidance explains that reimbursement rates are determined on the basis of the following components: planning; design; materials, equipment, and installation; and labor, management, maintenance, and training. From Figure 2, certain costs like seed and labor inputs grow at a rate approximating inflation; chem/fert/fuel costs, however, grow at uneven rates spatially and at rates that generally outpace the benchmark inflation rate.
To demonstrate the potential inflationary impacts on conservation, we start with a basic application of two previous cost estimates for rye cover crops. Specifically, we use budgets for cover crops by Zulauf and Schnitkey (see e.g., farmdoc daily, January 27, 2022) along with the estimates by Bergtold et al., from 2017 (Bergtold et al., 2017). Note that Bergtold’s estimates were for Kansas and based on survey results (SARE, 2013). The cost estimates from Zulauf and Schnitkey use the 2017 NASS Ag Census to provide estimates for Illinois (USDA-NASS, 2017). We merge these two estimates together to create a 2017 base estimate for cover crop costs in Illinois that aligns with the “group 1” pre-pandemic costs.
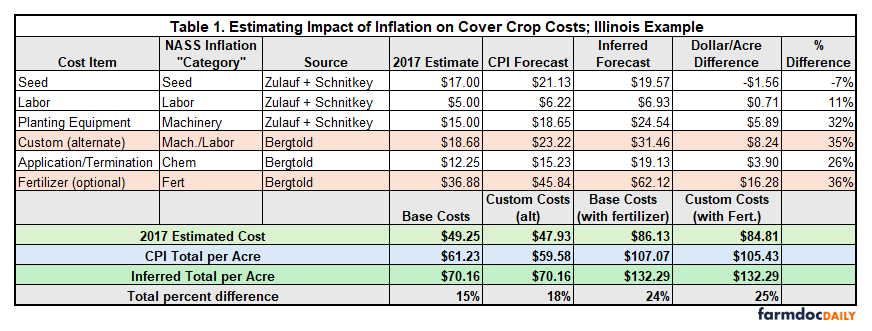
In Table 1, we take the 2017 base estimate and apply the CPI inflation estimates to calculate an estimated increase or difference in these costs for cover crops since 2017 (“CPI Forecast”). In the next column, we calculate an inflation estimate (“Inferred Forecast”) derived from the NASS cost changes identified in Figure 2 above. Inferred forecasts are calculated by assigning each cost component to one of the cost categories using the NASS data, and we used Illinois-specific data by year to compute cost increases per acre. Next to the inferred forecast is the dollar-per-acre difference in costs between the CPI inflation estimate and the inferred forecast. Because cover crop practices can be implemented in multiple ways, we also include an alternative cost to labor and equipment for custom seeding (third line, pink highlight). Finally, cover crop practices could include fertilizer needs and costs which are also included as an alternative calculation (fifth line).
While an inexact and preliminary measure, this look sheds light on the reality for farmers seeking to adopt conservation practices and highlights a considerable challenge for conservation policy. If inflation is driving up the cost of farming, it would also drive up the additional costs necessary for conservation practices, but Congress has authorized EQIP at fixed funding levels that do not adjust with inflation, costs, prices, revenues, or any other factor. The total budget authority for EQIP does increase in the statute, from $1.75 billion in fiscal years 2018 and 2019 to $2.025 billion for FY2023 to FY2031 (16 U.S.C. §3841). Using the same grouping method, this represents an increase in funding (approximately 10%) that is less than half of the CPI inflation rate and further below the inferred forecast. Looking specifically at funding for cover crops nationally, the post-pandemic years are just below the pre-pandemic years (99.5%) in funding. If the Inflation Reduction Act additional funding reported for cover crops is added to FY2023, the increase in cover crop funding is just over 9% in these years.
Concluding Thoughts
If nothing else, the estimates in Table 1 serve as a reminder that the impacts of inflation extend beyond the costs of producing cash crops for those farmers seeking to adopt conservation practices such as cover crops; different practices will be impacted at different rates, and much depends on how the practices are implemented. Importantly, the impacts of inflation have consequences for conservation not adequately considered in the policy and are mostly ignored in public discussions of farm policy. For cover crops, a reimbursement rate for base costs using standard CPI inflation calculations could be discounting the farmer’s actual costs by 15% (or 18% if custom seeding is used), while additional costs such as fertilizer could make this much worse. This becomes particularly meaningful because EQIP and other conservation programs are capped or based on fixed funding levels which do not increase with inflationary pressures. Working through inflationary questions for conservation highlights this policy design issue; specifically, the impact of limited, fixed conservation dollar allotments on overall farm conservation outcomes. While EQIP reimbursement rates are determined annually based on input cost estimates, the total number of federal dollars allotted to EQIP for reimbursements is not pegged to inflation and does not grow to accommodate the increased cost of conservation each year. This article adds further analysis and perspective, but much work remains.[1]
Note
[1] The authors thank the National Association of Conservation Districts for raising the inflation-conservation question and contributing funding that assisted with the research.
References
Bergtold, Jason S., Steven Ramsey, Lucas Maddy, and Jeffery R. Williams. "A review of economic considerations for cover crops as a conservation practice." Renewable Agriculture and Food Systems 34, no. 1 (2019): 62-76. https://www.cambridge.org/core/journals/renewable-agriculture-and-food-systems/article/review-of-economic-considerations-for-cover-crops-as-a-conservation-practice/488B324AD119DDC661D5F4271035FC1B.
Coppess, J. "Squeezing the Farmer, Part 1: Initiating Examination of a Persistent Challenge." farmdoc daily (14):175, Department of Agricultural and Consumer Economics, University of Illinois at Urbana-Champaign, September 26, 2024.
Coppess, J. and A. Knepp. "A View of the Farm Bill Through Policy Design, Part 1: EQIP." farmdoc daily (13):69, Department of Agricultural and Consumer Economics, University of Illinois at Urbana-Champaign, April 13, 2023.
Coppess, J. and I. Majumdar. "An Inflation Question Not Asked: What About Conservation?" farmdoc daily (14):98, Department of Agricultural and Consumer Economics, University of Illinois at Urbana-Champaign, May 23, 2024.
Hanrahan, R. “Ag economy is in a recession, says majority of ag economists.” Farm Policy News, Department of Agricultural and Consumer Economics, University of Illinois at Urbana-Champaign, October 22, 2024.
Paulson, N., G. Schnitkey, B. Zwilling and C. Zulauf. "2025 Illinois Crop Budgets." farmdoc daily (14):173, Department of Agricultural and Consumer Economics, University of Illinois at Urbana-Champaign, September 24, 2024.
Schnitkey, G., N. Paulson and C. Zulauf. "2024 Low Returns, Prices, and the Federal Safety Net." farmdoc daily (14):164, Department of Agricultural and Consumer Economics, University of Illinois at Urbana-Champaign, September 10, 2024.
Schnitkey, G., N. Paulson and C. Zulauf. "Implications of Non-Increasing Farmer Returns." farmdoc daily (14):168, Department of Agricultural and Consumer Economics, University of Illinois at Urbana-Champaign, September 17, 2024.
Schnitkey, G., N. Paulson, B. Zwilling, B. Goodrich, C. Zulauf and J. Baltz. "Perspectives and Strategies for Dealing with Low Farm Incomes in 2024 and Beyond." farmdoc daily (14):183, Department of Agricultural and Consumer Economics, University of Illinois at Urbana-Champaign, October 8, 2024.
Stubbs, Megan. “2018 Farm Bill Primer: Title II Conservation Programs.” Congressional Research Service, IF11199, May 3, 2019. https://crsreports.congress.gov/product/pdf/download/IF/IF11199/IF11199.pdf/.
Stubbs, Megan. “Agricultural Conservation and the Next Farm Bill.” Congressional Research Service, R47478. March 20, 2023. https://crsreports.congress.gov/product/pdf/download/R/R47478/R47478.pdf/.
Sustainable Agricultural Research and Education. 2013. Managing Cover Crops Profitably, Third edition. https://www.sare.org/wp-content/uploads/Managing-Cover-Crops-Profitably.pdf.
Zulauf, C. and G. Schnitkey. "Policy Budget for Cover Crops and the Lesson of Crop Insurance." farmdoc daily (12):12, Department of Agricultural and Consumer Economics, University of Illinois at Urbana-Champaign, January 27, 2022.
Disclaimer: We request all readers, electronic media and others follow our citation guidelines when re-posting articles from farmdoc daily. Guidelines are available here. The farmdoc daily website falls under University of Illinois copyright and intellectual property rights. For a detailed statement, please see the University of Illinois Copyright Information and Policies here.


