


An Inflation Question Not Asked: What About Conservation?
The House Agriculture Committee is scheduled to markup its version of the Farm Bill on Thursday, May 23, 2024 (House Agriculture Committee). The recent period of relatively high inflation and concerns about its impacts on production costs for farmers have occupied center stage in discussions about policy priorities. That discussion, however, has been narrow and one-dimensional, largely limited to increasing the reference prices in farm payment programs. For example, inflation for all farmers does not explain the significant differences in crop-by-crop reference price increases and the vast differences in payments among farmers in different regions (farmdoc daily, May 21, 2024; May 16, 2024; May 14, 2024; House Agriculture Committee, Farm Bill; Senate ANF Committee, May 1, 2024; see also, USDA-ERS, February 7, 2024). Among other things, this narrowed perspective—that only crop prices matter and that some farmers in some regions matter more than others—ignores the impact that inflation has on conservation assistance to farmers, as well as the consequences for farmers who adopt conservation practices. This article initiates a discussion of the inflation question not asked in farm policy debates, exploring the impacts of inflation on conservation costs and assistance.
Background
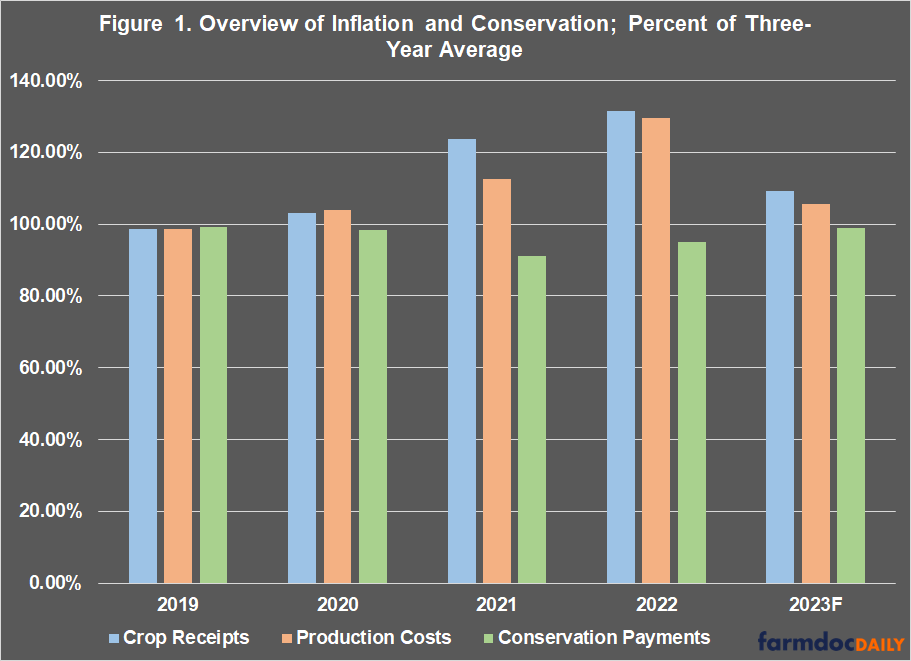
Inflation has unquestionably impacted farmers, as it has impacted everyone across the country (see e.g., farmdoc daily, December 1, 2022; January 19, 2023; September 11, 2023). As background to the discussion, Figure 1 presents a comparison for considering the inflation question, using the data reported by USDA’s Economic Research Service (ERS) for crop receipts, production costs (fertilizer, pesticides, fuel, energy, and seed), and conservation assistance to farmers (USDA-ERS, Farm Income and Wealth Statistics). Each year is presented as the percentage of the average of the three previous years under the 2018 Farm Bill, including the forecast for 2023. This is a limited snapshot—for example, these are not all costs a farmer must manage to produce a crop—but it offers context for exploring the question, especially the spike in crop receipts and costs for 2022 compared to conservation assistance.
Inflation would naturally impact the costs borne by farmers adopting conservation practices. For example, the cost of adopting cover crops would increase with seed, fuel, and herbicide costs. The discussion that follows begins an exploration of the potential impacts of inflation on conservation practice adoption. It also highlights a fundamental flaw in how Congress has chosen to fund conservation assistance: by preventing annual spending to keep pace with inflation, funding limits make the situation worse for programs that have been persistently underfunded and oversubscribed by farmers.
Discussion
Arguably, the largest reason why inflation impacts conservation assistance is due to Congress’ decision to cap available funding, as it does for two of the largest and oversubscribed conservation assistance programs: the Environmental Quality Incentives Program (EQIP) and the Conservation Stewardship Program (CSP). Congress authorized $2.025 billion per fiscal year (FY) for EQIP in the 2018 Farm Bill and $1 billion for CSP (see, 16 U.S.C. §3841). Simply adjusting for inflation would require a funding level for EQIP near $2.51 billion for FY2024 (see, Bureau of Labor Statistics, CPI Inflation Calculator). In other words, current funding for EQIP is roughly 81% of what Congress authorized in 2018 and the value of the conservation investment has decreased by 19% for farmers this year. The capped funding could also result in more dollars going to fewer farmers and being stretched across fewer adopted conservation practices. We review program data reported by USDA’s Natural Resources Conservation Service (NRCS) for indications that inflation is impacting conservation assistance (USDA-NRCS, RCA Data Viewer).
Figure 2 compares the national total funds and practice instance counts for a subset of EQIP practices closely associated with row crop production on working farmlands: conservation cover (327); conservation crop rotation (328); no-till (329); cover crop (340); reduced tillage (345); grassed waterway (412); and nutrient management (590). At the national level, Figure 2 indicates that EQIP is paying more for fewer of these practices, which would be expected with inflationary pressures on a capped program. Excluding 2020 as anomalous due to the Covid-19 pandemic, the average funds for these practices went from $163 million in the years prior to the pandemic (2017-2019 average), increasing to over $180 million in the three years after the pandemic (2021-2023 average). Total practice counts, however, decreased from 33,245 (2017-2019 average) to 26,275 (2021-2023 average). EQIP obligations increased by $17 million but those funds assisted with nearly seven thousand fewer practices. Effectively, 10.5% more funding resulted in 21% fewer practices, and the cost per practice increased by 40% or about $1,954 per practice adopted. Figure 2 indicates that inflation is very likely to be impacting conservation programs and the farmers seeking assistance to adopt practices: more dollars for fewer practices, at least for this subset of practices.
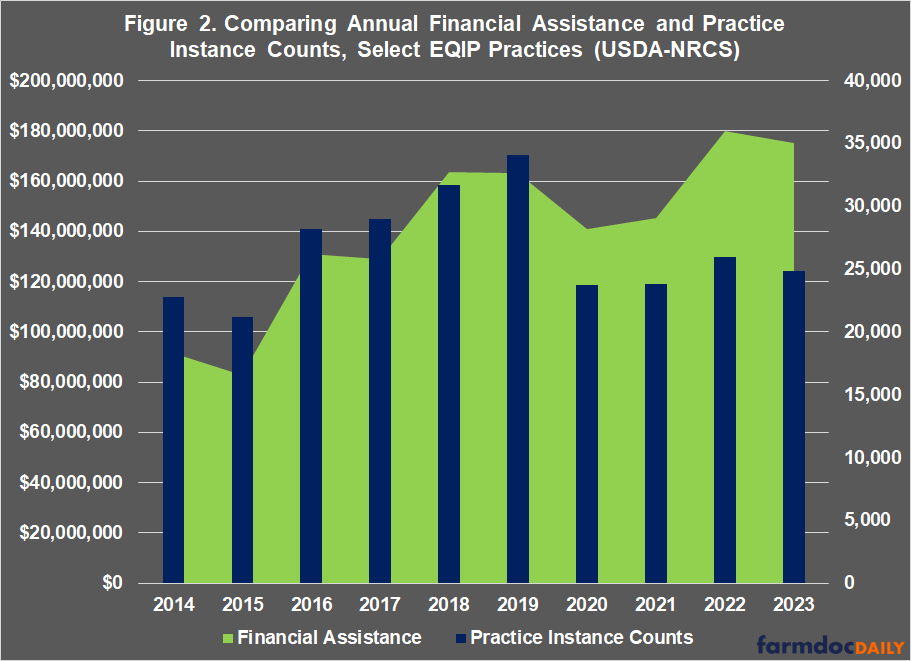
Figure 3 adds a regional perspective, comparing the percent change in funds and practices before Covid and after (2021 to 2023 average compared to 2017 to 2019 average). To better define the geographic distribution of agricultural production characteristics, USDA categorizes each county into one of nine Farm Resource Regions (See USDA, Farm Resource Regions). Figure 3 assigns each State to a Resource Region based on the highest number of counties within a given state in the Resource Region. The financial assistance obligations and practice counts reported for each State by NRCS are totaled for the States in each region. While there are notable differences among the regions, more funds were spent on these practices in total but fewer practices were funded. In the Mississippi Portal region, for example, the average funds increased 190% in the post-Covid years (2021 to 2023), while practice counts increased 157%; in the Heartland, by comparison, funds dropped by 16% but practice counts fell by 43%.
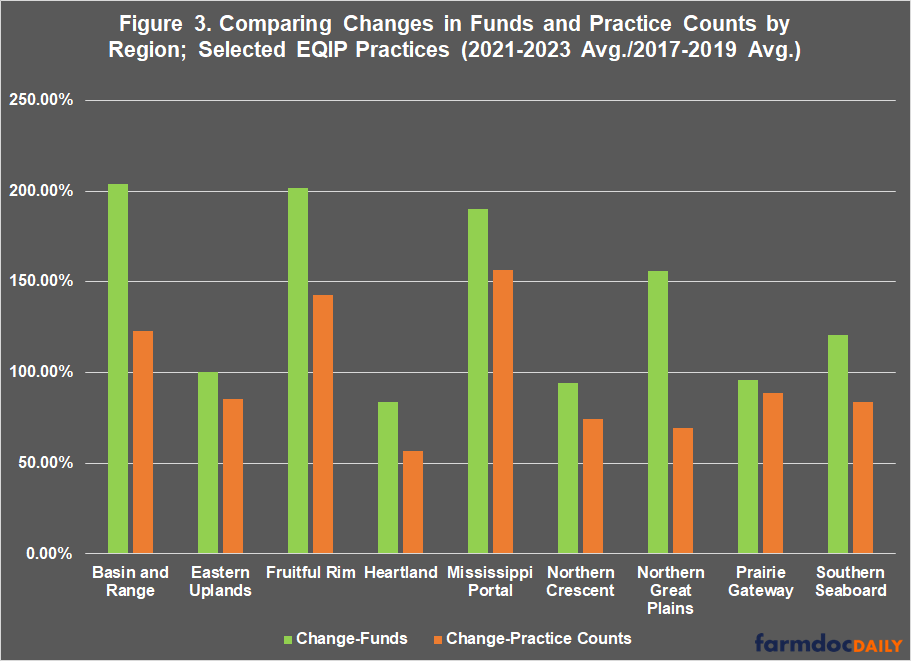
Figure 4 provides the same comparison but by practice for the subset of EQIP-funded practices. The recent average (2021 to 2023) is illustrated as a percent of the pre-Covid average (2017-2019). Conservation crop rotation (328) stands out, funding increased 4% while practice counts increased 64%. Conservation cover (327) experienced a decrease in funding by 40% while practice counts fell by 31%. All other practices compared in Figure 4 experienced increased funds but either a decrease in practice counts or an increase smaller than the funding increase.
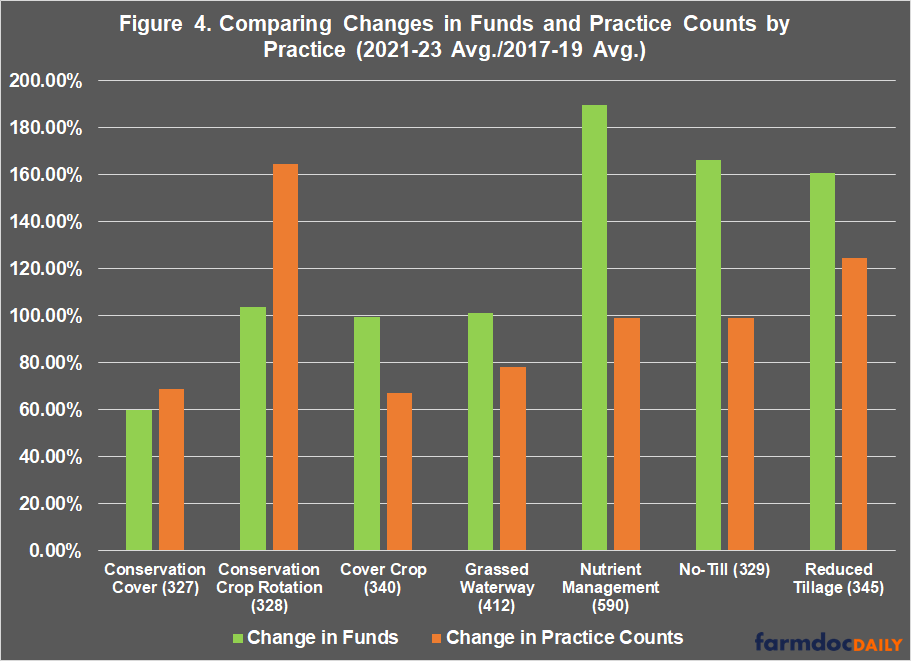
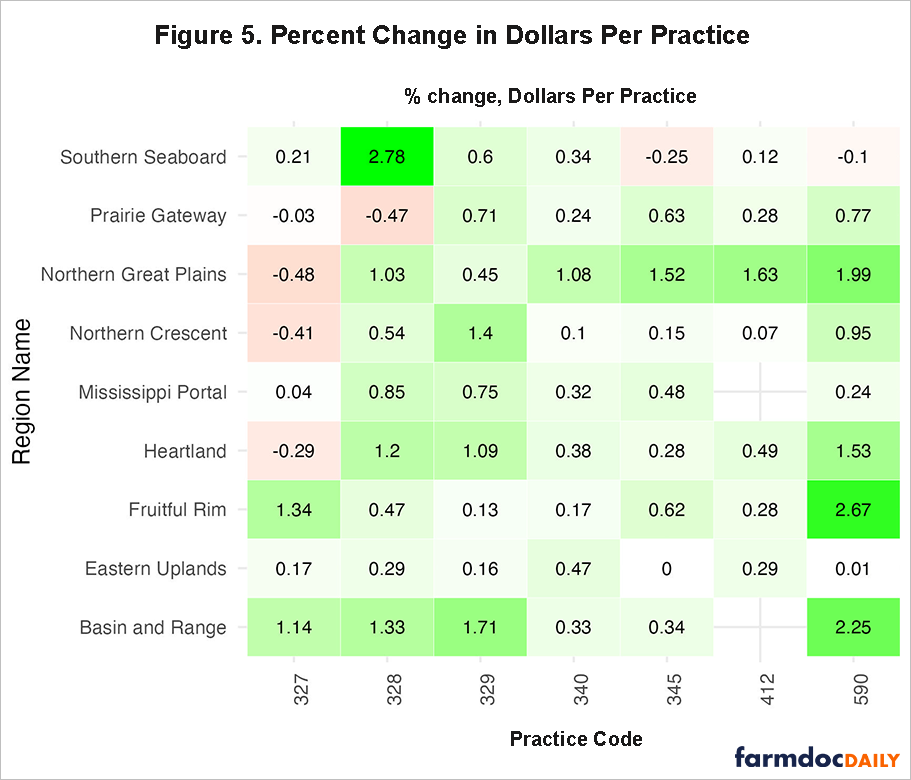
Figure 5 illustrates the percent change between pre-covid (2017-2019 average) and post-covid (2021-2023 average) periods in dollars-per-practice by practice and Resource Region. We calculated dollars per practice for each conservation activity by dividing the average of dollars obligated by the practice instance counts within each period. Percent changes vary widely both across regions for the same practice code, and across practice codes for the same region. With the exception of conservation cover (327), each practice saw observed increases in dollar expenditure relative to the number of practice instances across the majority of Resource Regions. Nutrient management (590) experienced a notably large percent change in the Eastern Uplands and Basin and Range Resource Regions, with dollars obligated per practice more than doubling between the pre-covid and post-covid periods.
Concluding Thoughts
Increased costs of production for row crop farmers during the post-pandemic inflationary period has been used to justify increasing reference prices in a 2024 Farm Bill, although justification for the substantial differences in the increases for individual program crops remains nonexistent. The pervasive practice of narrowly considering the farmers’ interests as simply crop prices relative to payment triggers has completely ignored the potential consequences of inflation for farmers seeking to adopt or maintain conservation practices. The discussion in this article initiates an exploration of that issue. Using data for a subset of EQIP practices, this initial review finds strong indications that inflation has limited conservation assistance to farmers, with more funds being spent on fewer practices. The data also indicate that the costs per practice adopted have increased. These initial findings, if supported by further data and analysis, raise substantial policy concerns because conservation programs like EQIP are capped by Congress and farmers have access to limited funding; if more of the limited funds achieve adoption of fewer practices, conservation investments are being further constrained or reduced. This is an issue that the Farm Bill reauthorization could address were it not consumed by changes to reference prices in the farm payment programs, which are not capped or otherwise limited by Congress.[i]
[i] The authors thank the National Association of Conservation Districts for contributing funding that assisted with the research on this topic.
References
Coppess, J., G. Schnitkey, N. Paulson, B. Sherrick and C. Zulauf. "Reference Price Disparities & Why It Matters to Farmers." farmdoc daily (14):93, Department of Agricultural and Consumer Economics, University of Illinois at Urbana-Champaign, May 16, 2024.
House Committee on Agriculture. Chairman Thompson Delivers Opening Statement at Markup of the Farm, Food, and National Security Act of 2024. May 23, 2024. https://agriculture.house.gov/
Kalaitzandonakes, M., B. Ellison and J. Coppess. "How Us Consumers Say They’re Coping With Rising Food Prices: Results From the Gardner Food and Agricultural Policy Survey." farmdoc daily (13):10, Department of Agricultural and Consumer Economics, University of Illinois at Urbana-Champaign, January 19, 2023.
Kalaitzandonakes, M., B. Ellison and J. Coppess. "Rising Food Prices Stress US Consumers, but Views of Food System Hold Steady: Gardner Food and Agricultural Policy Survey, Third Quarter Results." farmdoc daily (12):181, Department of Agricultural and Consumer Economics, University of Illinois at Urbana-Champaign, December 1, 2022.
Kalaitzandonakes, M., J. Coppess and B. Ellison. "GFAPS Results: Consumer Perception of Food System Affordability Drops." farmdoc daily (13):164, Department of Agricultural and Consumer Economics, University of Illinois at Urbana-Champaign, September 11, 2023.
Schnitkey, G., J. Coppess, N. Paulson, B. Sherrick and C. Zulauf. "Spending Impacts of House Proposal for Commodity Title Changes." farmdoc daily (14):96, Department of Agricultural and Consumer Economics, University of Illinois at Urbana-Champaign, May 21, 2024.Schnitkey, G., N. Paulson, C. Zulauf, J. Coppess and B. Sherrick. "Statutory Reference Prices and the Next Farm Bill." farmdoc daily (14):91, Department of Agricultural and Consumer Economics, University of Illinois at Urbana-Champaign, May 14, 2024.
U.S. Department of Agriculture, Economic Research Service. Farm Income and Wealth Statistics. Last updated February 7, 2024, accessed May 23, 2024. https://www.ers.usda.gov/data-products/farm-income-and-wealth-statistics/data-files-u-s-and-state-level-farm-income-and-wealth-statistics/.
U.S. Department of Agriculture, Economic Research Service. Farm Sector Income & Finances: Highlights from the Farm Income Forecast, Last updated February 7, 2024, accessed May 23, 2024. https://www.ers.usda.gov/topics/farm-economy/farm-sector-income-finances/highlights-from-the-farm-income-forecast/.
U.S. Department of Agriculture, Natural Resources Conservation Service. RCA Data Viewer. https://www.nrcs.usda.gov/resources/data-and-reports/rca-data-viewer.
Disclaimer: We request all readers, electronic media and others follow our citation guidelines when re-posting articles from farmdoc daily. Guidelines are available here. The farmdoc daily website falls under University of Illinois copyright and intellectual property rights. For a detailed statement, please see the University of Illinois Copyright Information and Policies here.