2025 Illinois Crop Budgets
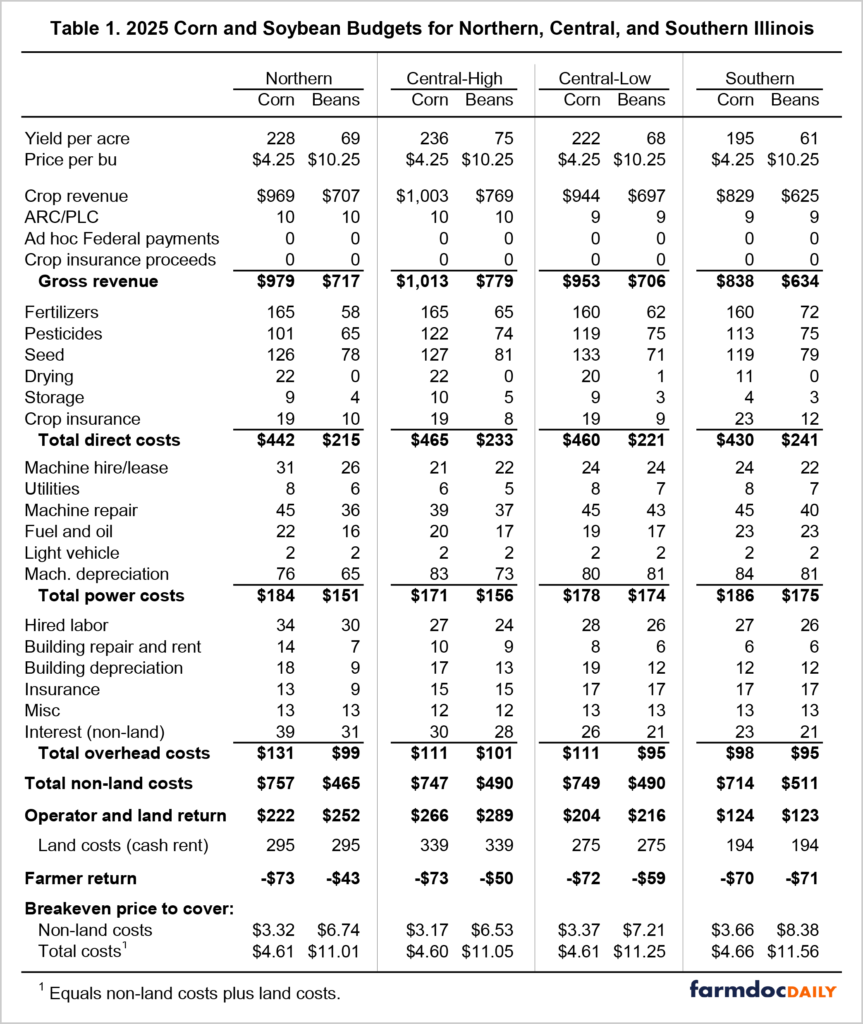
Illinois crop budgets for 2025 are now available HERE in the Management section of the farmdoc website. Overall, projections are for lower production costs for corn and soybeans in 2025 compared with 2024. Projected cost reductions primarily come from lower fertilizer and fuel costs. Break-even prices to cover all costs, including cash rent for farmland, range from $4.60 to $4.66 per bushel for corn and $11.01 to $11.56 per bushel for soybeans. Despite lower cost projections, current expectations for corn and soybean prices suggest negative farmer returns to corn and soybeans across all regions of Illinois in 2025.
2025 Crop Budgets
Crop budgets are prepared for three regions of Illinois: northern, central, and southern (see Table 1). Central Illinois budgets are further broken out for high- and low-productivity farmland in the region. Over the past 5 years (2019-2023), corn yields on high-productivity land in central Illinois have averaged 222 bushels per acre, while yields on low-productivity land has averaged 208 bushels per acre.
The farm records from Illinois Farm Business Farm Management (FBFM) provide historical data for the 2025 projections. Summaries of FBFM records are available from 2018 to 2023 in a farmdoc publication entitled Revenue and Costs for Illinois Grain Crops. The budget projections provided in table 1 are informed by the historical summaries as follows:
- Projected yields are based on historical linear trends fit to each region from 2000 to 2023. Trend yield projections for corn in 2025 are 228 bushels per acre in northern Illinois, 236 (high-productivity) and 222 (low-productivity) in central Illinois, and 195 in southern Illinois. Trend soybeans yields are 69 bushels per acre in northern Illinois, 75 (high-productivity) and 68 (low-productivity) in central Illinois, and 61 in southern Illinois.
- Corn and soybean price projections are for an average market year price received by farmers in Illinois. They are based on current futures prices on Chicago Mercantile Exchange (CME) contracts that would be used to market the 2025 crop and the latest USDA projections for national 2025 market year average prices.
- Projected 2025 costs are based on 2023 costs (the most current year for which FBFM summaries exist), 2024 cost projections, available information on input price changes, and expectations for costs over the following year.
Given projected price levels for 2025, revenues include crop revenues and a relatively small ARC/PLC payment. Crop insurance and ad hoc programs could provide additional payments for 2025. Insurance indemnities would require price or yield losses relative to guarantees that will reflect relevant price and yield expectations when they are determined, and ad hoc support would require congressional or administrative action.
Total non-land costs include:
- Direct costs include crop inputs such as fertilizers, pesticides, seed, drying, storage, and crop insurance premiums. These costs will vary with input prices, crop planted, and conditions experienced throughout the growing season.
- Power costs are associated with machinery and power: machinery hire, utilities, machinery repair, fuel and oil, light vehicle, and machinery depreciation. Machinery depreciation is based on an economic life of ten years (for most equipment), assumes no salvage value, and will differ from tax depreciation (does not include any accelerated depreciation).
- Overhead costs include hired labor, building repair and rent, building depreciation, insurance, miscellaneous, and interest on non-land costs.
Operator and land return equals gross revenue minus non-land costs, representing the return to both farmer and land. Subtracting out a land cost results in net farmer return. The Illinois crop budgets include an average cash rent value, which varies by region, as a measure of land costs.
Projected farmer returns are negative for corn and soybeans across all regions of Illinois for 2025 (see Table 1). Farmer return projections for corn range from -$70 to -$73 per acre. Farmer return projections for soybeans range from -$43 to -$71 per acre for soybeans.
Estimated break-even prices to cover non-land and total costs are provided by region at the bottom of table 1. Break-even corn prices to cover non-land costs range from $3.17 to $3.66 per bushel; break-even corn prices increase to $4.60 to $4.66 per bushel for all costs. Break-even soybean prices to cover non-land costs range from $6.53 to $8.38 per bushel; break-even soybean prices increase to $11.01 to $11.56 per bushel for all costs.
Recent Returns
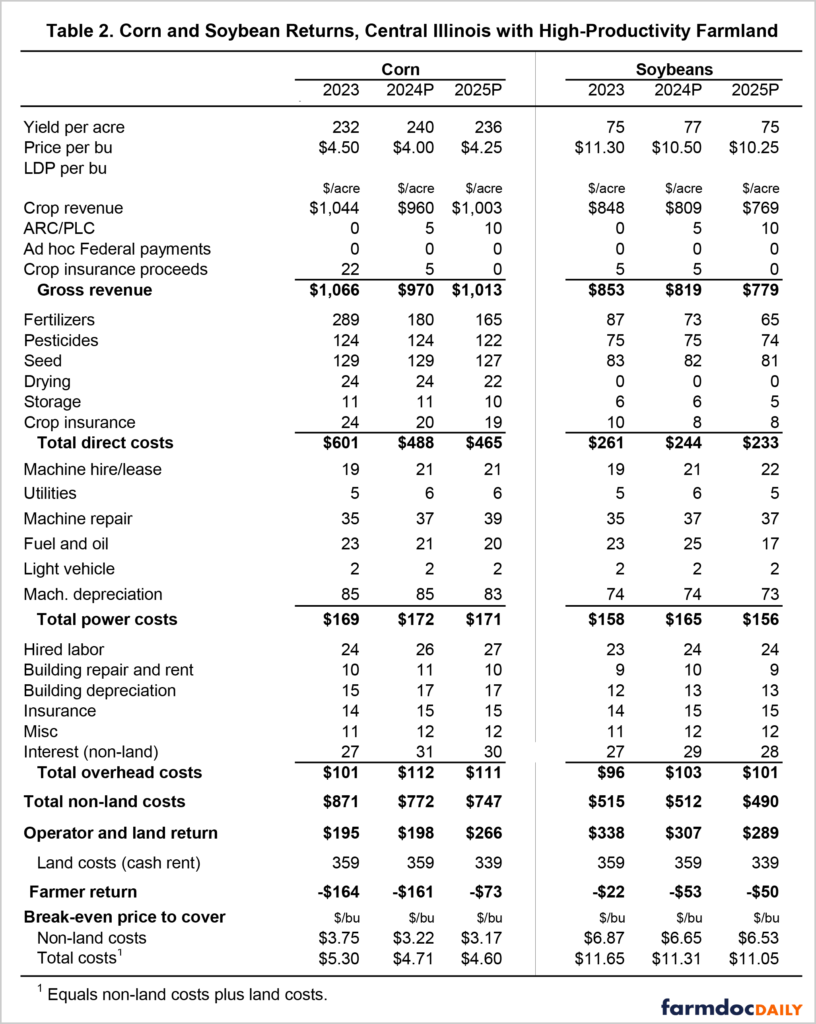
Table 2 compares the 2025 budgets to 2023 actual results and current expectations for 2024 returns for high-productivity land in central Illinois. Negative returns occurred for both corn and soybeans in 2023 as non-land costs reached historic highs and corn and soybean prices were lower than for the 2021 and 2022 crop years (see farmdoc daily from September 20, 2024). Cost reductions are projected for 2024, mainly due to lower fertilizer prices. However, continued low prices imply negative returns for 2024 even with lower costs and exceptional yields expected in Illinois.
Further cost reductions are projected for 2025, again led by lower fertilizer prices. Slightly lower costs are expected in other direct cost items compared with 2024. Power costs are projected to be the same to slightly lower in 2025 compared with 2024, with reductions led by lower fuel prices. Overhead costs are projected to remain similar to levels expected for 2024. While interest rates may decline heading into 2025, the need for more operating funds as liquidity positions decline seem likely to offset the potential for any significant reduction in per acre interest costs. Average cash rents are projected to decline in 2025, a result of multiple years of negative returns being expected to force reductions in rent levels.
Even with lower costs expected for 2025, current price expectations result in poor return projections. Across regions of Illinois, projected corn and soybean returns improve relative to 2024 but remain negative for 2025. Central Illinois returns to high-productivity land for corn are projected at -$73 per acre for 2025, compared with -$161 for 2024. Similarly, projected returns to soybeans for 2025 are -$50 per acre, compared with -$53 for 2024.
Commentary
Corn and soybean prices have continued to decline from their peaks in mid-2022. While some input prices, such as fertilizer and fuels, have also declined from their 2022 peaks and other adjustments have been made, production costs remain above pre-2020 levels. History would suggest further cost adjustments may continue to occur but will do so gradually over multiple years.
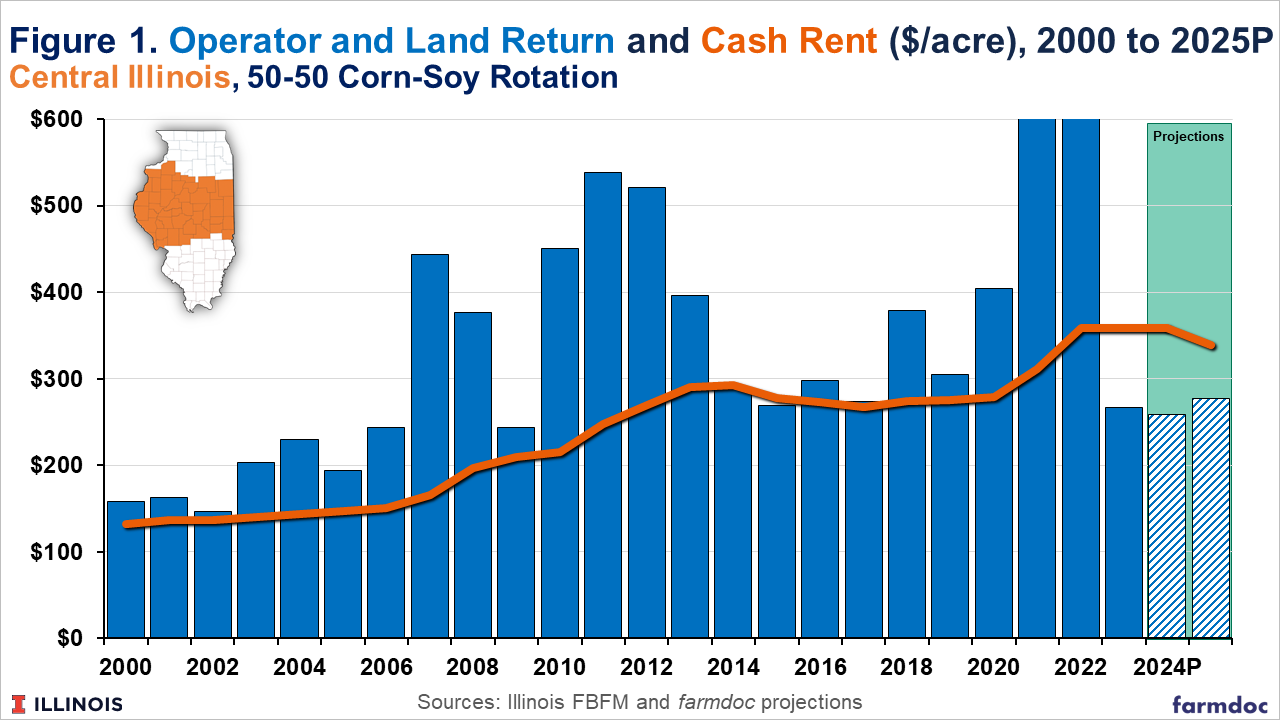
Figure 1 shows historical operator and land returns for a 50-50 corn-soybean rotation, and average cash rents since 2000 for high-productivity farmland in central Illinois, along with projections for 2024 and 2025. The record returns earned from 2020 to 2022 put Illinois farms in strong financial positions, on average, heading into the lower returns that occurred in 2023 and are projected for 2024 and 2025 (see farmdoc daily articles from March 22, 2024 and April 26, 2024). While the current situation shares similarities with the high return period from 2006 to 2013 followed by lower prices and returns from 2014 to 2019, there are also stark differences.
The returns from 2020-2022 were even larger than those experienced from 2006 to 2013. However, farmer returns since 2023 have also been significantly more negative than the roughly break-even returns experienced, on average, from 2014 to 2019. There exists the potential for rapid erosion of accumulated resources and resulting financial stress. This is particularly true for farms who are highly reliant on cash rented acres, which tend to be younger operators who have not yet been able to establish a meaningful owned farmland base or adequate working capital to help in smoothing negative income shocks (see farmdoc daily from September 17, 2024).
Recent precedent would suggest the potential exists for income support through ad hoc assistance. Whether that will occur, and how support payments might be defined, remains an open question as the 2024 harvest season begins.
Acknowledgments
The authors would like to acknowledge that data used in this study comes from the Illinois Farm Business Farm Management (FBFM) Association. Without Illinois FBFM, information as comprehensive and accurate as this would not be available for educational purposes. FBFM, which consists of 5,000+ farms and 70 professional field staff, is a not-for-profit organization available to all farm operators in Illinois. FBFM field staff provide independent, on-farm counsel along with recordkeeping, farm financial management, business entity planning and income tax management. For more information, please contact our office located on the campus of the University of Illinois at 217-333-8346 or visit the FBFM website at www.fbfm.org.
References
Mashange, G., G. Schnitkey and B. Zwilling. "Solvency Trends for Illinois Grain Farms: The Distribution of Debt-to-Asset Ratios by Gross Farm Returns." farmdoc daily (14):80, Department of Agricultural and Consumer Economics, University of Illinois at Urbana-Champaign, April 26, 2024.
Mashange, G. and B. Zwilling. "Liquidity Trends for Illinois Farms: Comparing Farms by Gross Farm Returns from 2003-2022." farmdoc daily (14):58, Department of Agricultural and Consumer Economics, University of Illinois at Urbana-Champaign, March 22, 2024.
Schnitkey, G., N. Paulson and C. Zulauf. "Implications of Non-Increasing Farmer Returns." farmdoc daily (14):168, Department of Agricultural and Consumer Economics, University of Illinois at Urbana-Champaign, September 17, 2024.
Zwilling, B. "Higher Costs and Lower Grain Prices Lead to Lower Farm Earnings in 2023." farmdoc daily (14):171, Department of Agricultural and Consumer Economics, University of Illinois at Urbana-Champaign, September 20, 2024
Disclaimer: We request all readers, electronic media and others follow our citation guidelines when re-posting articles from farmdoc daily. Guidelines are available here. The farmdoc daily website falls under University of Illinois copyright and intellectual property rights. For a detailed statement, please see the University of Illinois Copyright Information and Policies here.


