


U.S. Commercial Banks Participating in Agricultural Lending Report: 2024 Q4
In our previous article (see farmdoc daily, March 12, 2025), we compared agricultural credit conditions between the Chicago and St. Louis Federal Reserve Districts in the fourth quarter of 2024. We found that loan demand in the St. Louis District remained relatively stable in 2024, while the Chicago District saw an upward trend in the latter quarters of the year. Both regions, however, have experienced a steady decline in loan repayment rates since the first quarter of 2022. Additionally, average fixed interest rates on operating and farm real estate loans in both regions have been trending lower. For producers in Illinois, preliminary data from FBFM indicates that liabilities rose 2 to 7%, with interest expenses increasing by 20 to 30%, while working capital fell by 20 to 30% in 2024.
We now examine the outstanding loan balances held by commercial banks that issued agricultural loans in the fourth quarter of 2024, along with their performance ratios using data from the Federal Deposit Insurance Corporation (FDIC) Consolidated Reports of Condition and Income.
We categorize our sample of commercial banks into two lending specializations since some lenders extend more credit for agricultural purposes than others. Commercial banks whose sum of farm and production loans is at least 25% of their net loans and leases are defined as agricultural banks, while all others are defined as non-agricultural banks.[1] In the fourth quarter of 2024, a total of 3,485 commercial banks held agricultural loans on their balance sheets, with 986 classified as agricultural banks and 2,499 as non-agricultural banks.[2];[3] In our tables below, we created five size categories based on the size of the bank’s total assets: (1) Less than $100M, (2) $100M-$250M, (3) $250M-$1B, (4) $1B-$10B, and (5) Greater than $10B. Notably, no agricultural banks in the fourth quarter of 2024 fell into the Greater than $10B category in our sample, compared to the 115 non-agricultural banks in this size category.
Outstanding Agricultural Loans Held by Commercial Banks Participating in Ag Lending
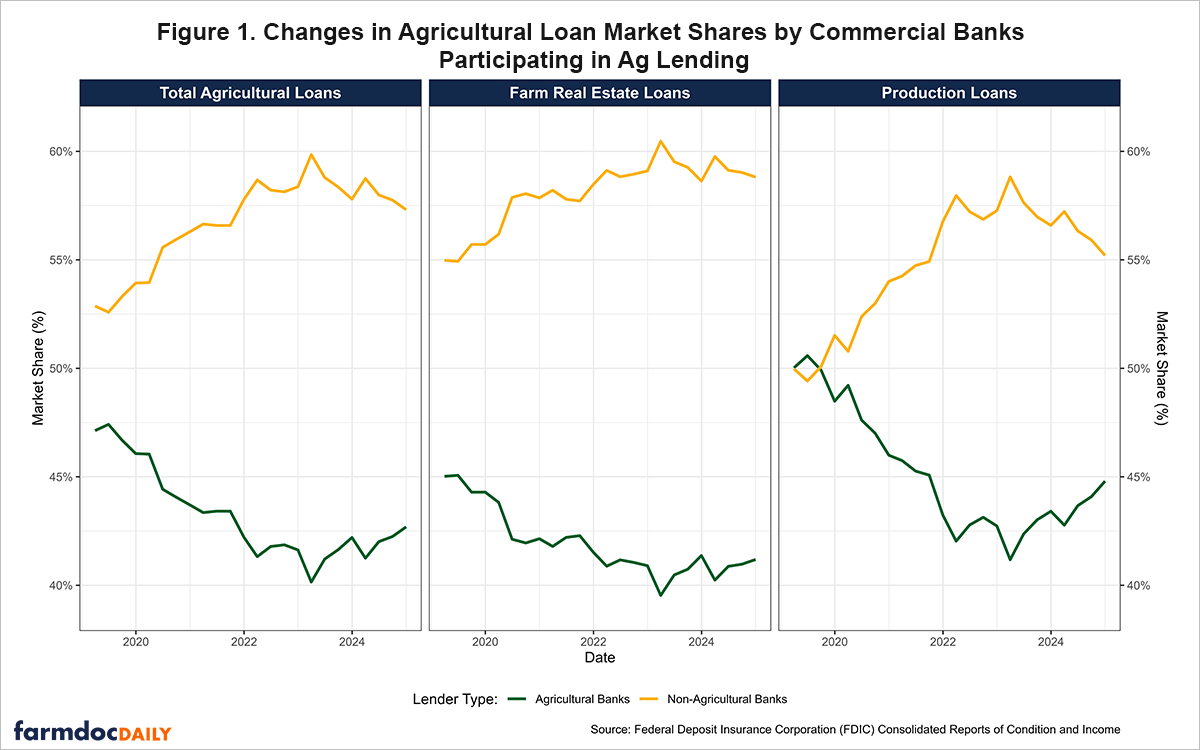
Figure 1 illustrates the trends in market shares of outstanding agricultural loans between agricultural and non-agricultural commercial banks from Q1 2019 to Q4 2024. Non-agricultural banks steadily increased their market share of outstanding agricultural loans from 52.87% in Q1 2019 to 59.85% in Q1 2023. Since then, agricultural banks have modestly regained some market share, increasing from 40.15% in 2023 Q1 to 42.69% in 2024 Q4, with the largest gains being in outstanding production loans.
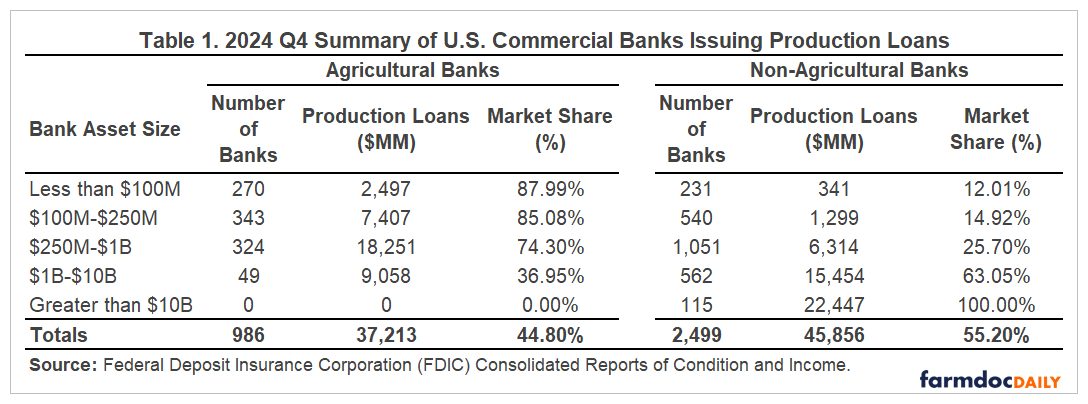
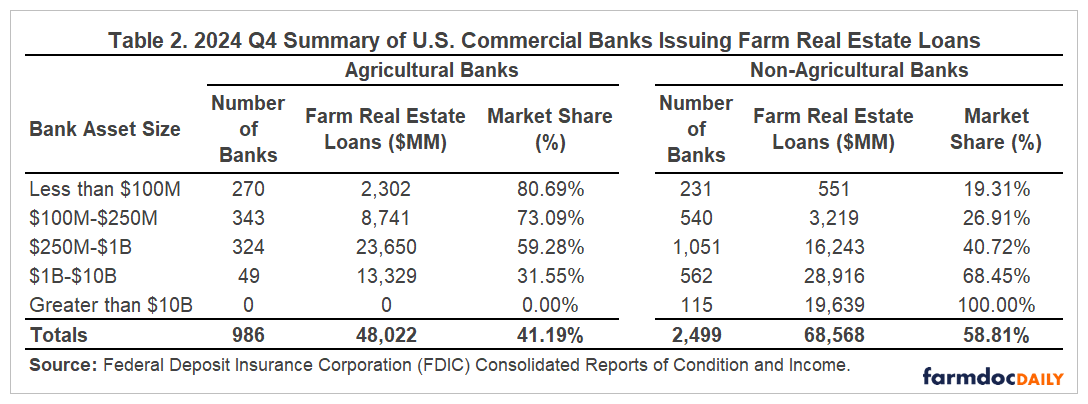
Tables 1 and 2 present the distribution of outstanding production loans and farm real estate loans, respectively, held by commercial banks, categorized by their bank asset size and lending specialization. Agricultural banks reported $37.2 billion in outstanding production loans and $48.0 billion in farm real estate loans, representing 44.80% and 41.19%, respectively, of the share amongst commercial banks. Interestingly, at a granular level, the dominance in market share in production and farm real estate loans varied by bank asset size during the period. As the bank asset size of non-agricultural banks increased, so did their market share. For example, agricultural banks with assets less than $100 million dominated their size category in the fourth quarter of 2024, holding 87.99% of outstanding production loans and 80.69% of farm real estate loans compared to non-agricultural banks of the same size. In contrast, compared to agricultural banks of the same sizes, non-agricultural banks with $1B-$10B in assets held 63.05% of production loans and 68.45% of farm real estate loans, while those exceeding $10B in assets held 100% of both loan types.
Performance Ratios of Commercial Banks Participating in Ag Lending
Table 3 presents select average performance ratios of commercial banks participating in agricultural lending, categorized by their bank asset size and lending specialization in Q4 2024. The Yield on Earning Assets (YOEA), measures annualized interest income as a percentage of average earning assets. The Cost of Funding Earning Assets (COFEA), is defined as the annualized interest expense on deposits and other borrowed money as a percent of average earning assets. Net Interest Margin (NIM)—calculated as the difference between YOEA and COFEA—measures bank profitability and represents the spread between interest income and funding costs.
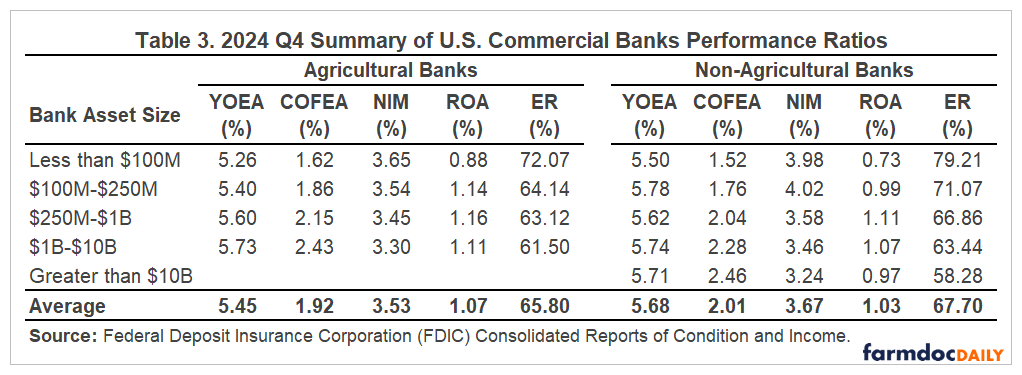
Non-agricultural banks reported a higher average NIM (3.67%) in the fourth quarter compared to agricultural banks (3.53%). The entire banking industry reported an average NIM of 3.28% in Q4 2024, slightly higher (5 basis points) than the previous quarter (see FDIC Quarterly Banking Profile Fourth Quarter 2024). Although non-agricultural banks incurred a higher average cost of funds (2.01%) compared to agricultural banks (1.92%), the latter generated a lower average yield on its earning assets (5.45%) compared to the former (5.68%). In both lending specializations, average cost of funds increased with bank asset size in the quarter. In terms of margins, agricultural banks with assets less than $100 million reported the highest average NIM (3.65%), while those with assets between $1B-$10B reported the lowest value (3.30%). On the other hand, non-agricultural banks with assets greater than $10B reported the lowest average NIM (3.24%), while those with assets between $100M-$250M reported the highest NIM (4.02%). The three rate cuts made by the Federal Reserve in the second half of the year is reflected by the industry average NIM improving as a result of the average YOEA and COFEA falling by 0.19 percentage points and 0.24 percentage points, respectively (see FDIC Quarterly Banking Profile Fourth Quarter 2024).
We also report the Return on Assets (ROA) and Efficiency Ratio (ER) in Table 3. ROA is another measure of profitability and is defined as annualized net income as a percent of average total assets. The ER represents the share of a bank’s income spent on operations and is defined as noninterest expense as a percent of net operating income i.e., net interest income plus noninterest income. A lower ER indicates greater efficiency. Agricultural banks attained greater profitability in the fourth quarter, with an average ROA of 1.07% compared to 1.03% for non-agricultural banks. The ROA for the entire banking industry in Q4 2024 was 1.11%, 0.50 percentage points higher than a year ago, according to the FDIC (see FDIC Quarterly Banking Profile Fourth Quarter 2024). Across both lending specializations, banks with assets less than $100M reported the lowest average ROA, while those with $250M-$1B in assets reported the highest ROA. Agricultural banks also operated more efficiently in the period, reporting an average ER of 65.80% compared to non-agricultural banks’ 67.70%. Furthermore, across all asset size categories, agricultural banks reported lower average ERs i.e., they were more efficient across each size category in the fourth quarter.
Note: FDIC definitions of the variables presented in the table are as follows: (1) YOEA: Yield on Earning Assets is the total annualized interest income as a percent of average earning assets (all loans and other investments that earn interest or dividend income); (2) COFEA: Cost of Funding Earning Assets is the annualized total interest expense on deposits and other borrowed money as a percent of average earning assets on a consolidated basis; (3) NIM: Net Interest Margin is the annualized total interest income minus total interest expense as a percent of average earning assets; (4) ROA: Return on Assets is the annualized net income after taxes and extraordinary items as a percent of average total assets; and (5) ER: Efficiency Ratio is noninterest expense less the amortization of intangible assets as a percent of net interest income plus noninterest income.
Conclusion
In summary, agricultural banks demonstrated higher profitability, with an average Return on Assets of 1.07% compared to 1.03% for non-agricultural banks, and greater operational efficiency, reporting an average Efficiency Ratio of 65.80% versus 67.70% in the fourth quarter of 2024. Performance varied by bank size, with smaller agricultural banks (less than $100M) achieving the highest Net Interest Margin (3.65%) and dominating their asset size category in agricultural loan market share. Conversely, larger non-agricultural banks (greater than $10B) held 100% of agricultural loans in their size category but reported the lowest Net Interest Margin (3.24%).
Acknowledgment
The authors would like to acknowledge that data used in this study comes from the Illinois Farm Business Farm Management (FBFM) Association. Without Illinois FBFM, information as comprehensive and accurate as this would not be available for educational purposes. FBFM, which consists of 5,000+ farmers and 70 professional field staff, is a not-for-profit organization available to all farm operators in Illinois. FBFM field staff provide on-farm counsel along with recordkeeping, farm financial management, business entity planning and income tax management. For more information, please contact our office located on the campus of the University of Illinois in the Department of Agricultural and Consumer Economics at 217-333-8346 or visit the FBFM website at www.fbfm.org.
Notes
[1] We only consider commercial banks that issued agricultural loans in the fourth quarter of 2024 for our analysis.
[2] Commercial banks in our sample belong to one of the following institution classes: (1) N – Commercial bank, national (federal) charter, Fed member, and supervised by the Office of the Comptroller of the Currency (OCC); (2) NM – Commercial bank, state charter, Fed non-member, and supervised by the Federal Deposit Insurance Corporation (FDIC); and (3) SM – Commercial bank, state charter, Fed member, and supervised by the Federal Reserve Bank (FRB).
[3] To qualify for inclusion in our sample, commercial banks must have reported deposits, loans, and leases on their balance sheets.
References
Federal Deposit Insurance Corporation. “FDIC Quarterly Banking Profile Fourth Quarter 2024”. February 25, 2025.
Mashange, G. and B. Zwilling. "Illinois Agricultural Credit Conditions: 2024 Q4." farmdoc daily (15):47, Department of Agricultural and Consumer Economics, University of Illinois at Urbana-Champaign, March 12, 2025.
Disclaimer: We request all readers, electronic media and others follow our citation guidelines when re-posting articles from farmdoc daily. Guidelines are available here. The farmdoc daily website falls under University of Illinois copyright and intellectual property rights. For a detailed statement, please see the University of Illinois Copyright Information and Policies here.