


Comparing Breakeven Prices for Soybeans and Corn in Illinois Since 2000
The ratio of breakeven prices for soybeans to corn in central Illinois declined from 2000 to 2010, while the ratio of market prices for soybeans to corn has remained around a stable average since the mid-1970s. This implies a relative improvement in profitability potential for soybeans over corn which has been driven by changes in relative costs. While producers’ costs on a per acre basis have increased over time for both crops, soybean productions costs – particularly those associated with direct inputs – have increased less, in relative terms, than for corn.
Soybean-to-Corn Breakeven Price Ratio
Figure 1 plots the ratio of the breakeven prices for soybeans to corn on high productivity farmland in central Illinois from 2000 to 2023, with projections for 2024 and 2025 based on the January 2025 Illinois crop budgets (see farmdoc daily article from January 14, 2025). Two series are provide in Figure 1 – the ratio of breakeven prices to cover non-land costs and the ratio of breakeven prices to cover total costs (non-land costs plus cash rent). Actual price ratios above the breakeven price ratio indicate a relative profitability advantage for soybeans, while actual price ratios lower than the breakeven price ratios indicate a relative advantage for corn.
Both breakeven price ratios trended down during the 2000s. This corresponds to the period when corn was increasingly being used for ethanol production, with higher prices and larger returns to corn production leading to more rapidly increasing costs. The breakeven price ratio reached a low for the 25 year period shown in Figure 1 in the drought year of 2012, which had a large negative impact on corn yields leading to a much higher breakeven corn price compared with soybeans. Since 2013, the breakeven price ratio has varied around a stable and slightly higher average. This figure suggests that soybeans may have gained relative profitability advantages over soybeans that has continued to persist.
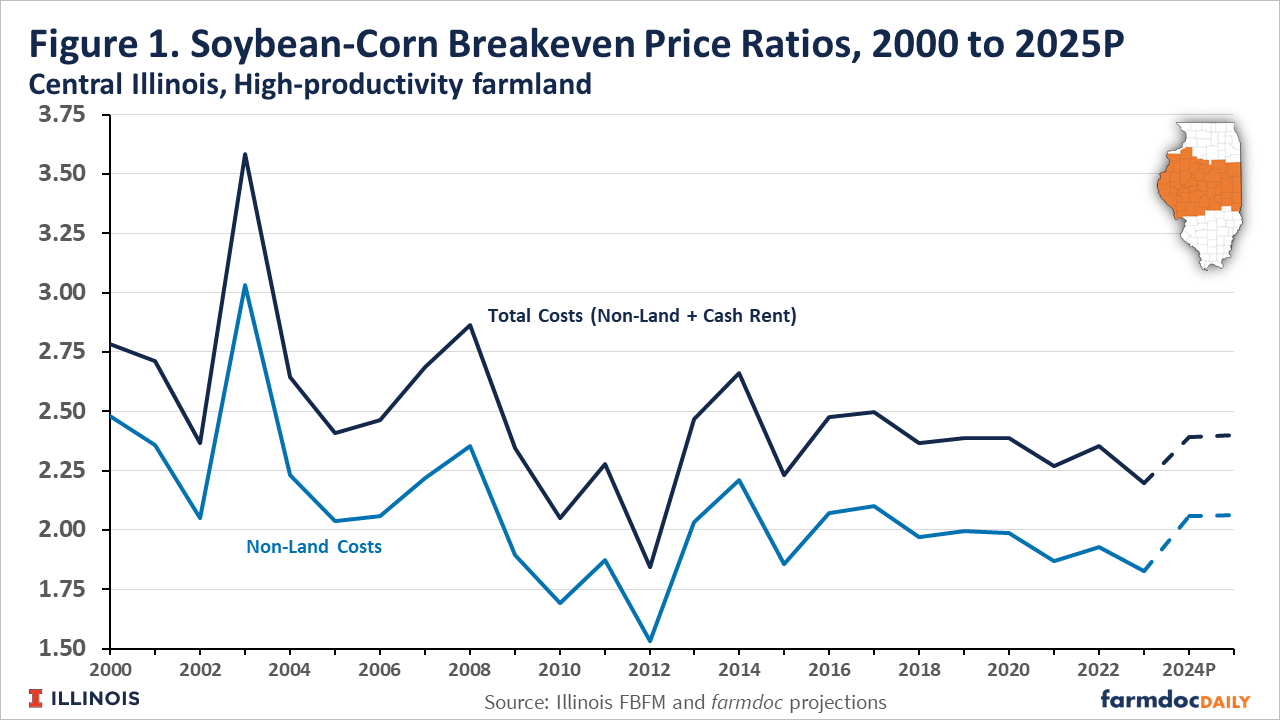
Breakeven prices are determined by a crop’s production cost relative to yield. Both yields and production costs on a per acre basis have increased for corn and soybeans over time (see farmdoc daily articles from March 21, 2023; September 26, 2023; November 14, 2023). If the soybean to corn breakeven price ratio is trending down, as it did in the 2000s in central Illinois, it is an indication that 1) soybean yields were increasing at a faster rate than those for corn, 2) the cost per acre to produce soybeans was increasing at a slower rate than for corn, or 3) both were occurring.
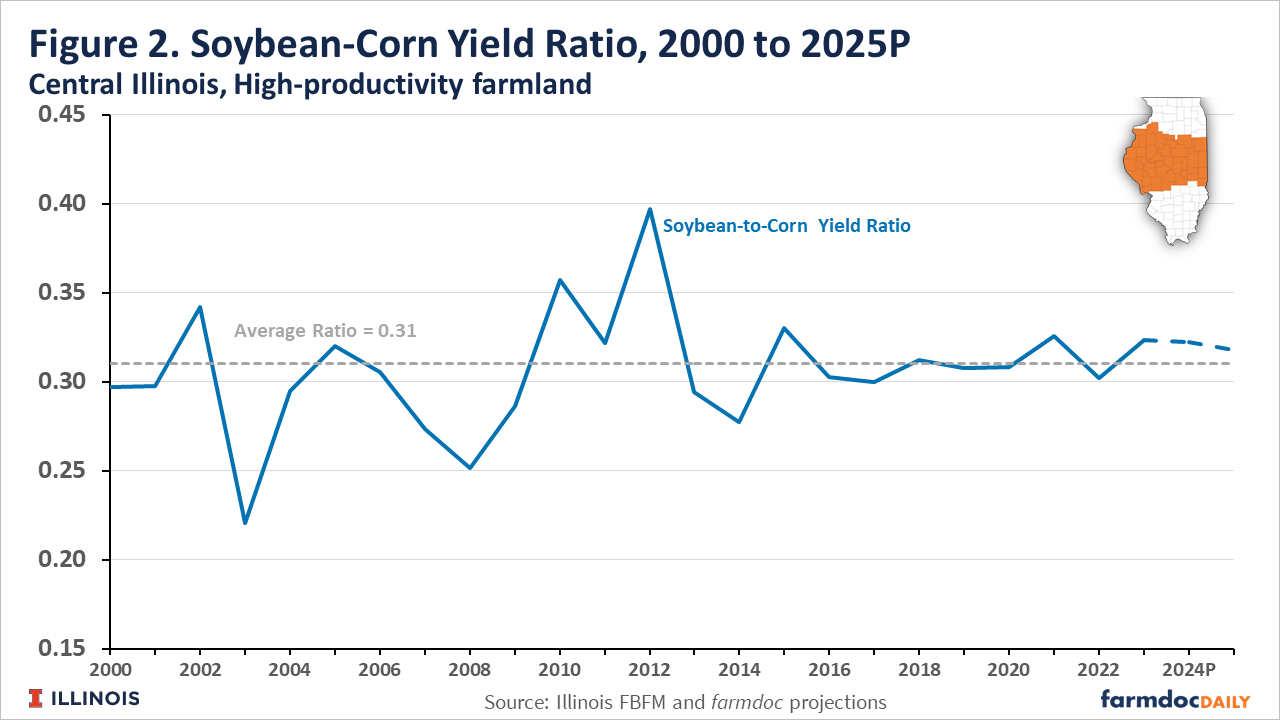
Relative Yields
Figure 2 shows the ratio of soybean to corn yields in central Illinois from 2000 to 2023, with projections for 2024 and 2025. The yield ratio for central Illinois has varied around an average of 0.31, with no clear trends up or down, over the last 25 years. This differs from the downward trend in the soybean-to-corn yield ratio that has persisted at the national level since the mid-1970s (see Figure 3 and related discussion in the farmdoc daily article from March 10, 2021).
Relative Costs
Figure 3 reports the ratio of non-land costs, and the ratio of the subcategories of non-land costs (direct costs, power costs, and overhead costs), for soybeans and corn in central Illinois since 2000. The ratio of non-land costs per acre for soybeans to corn trended down during the 2000s, and then remained stable from 2010 through 2023. This supports the contribution of changes in the relative costs of production for corn and soybeans driving the trend in the breakeven price ratios illustrated in Figure 1 over the same time period.
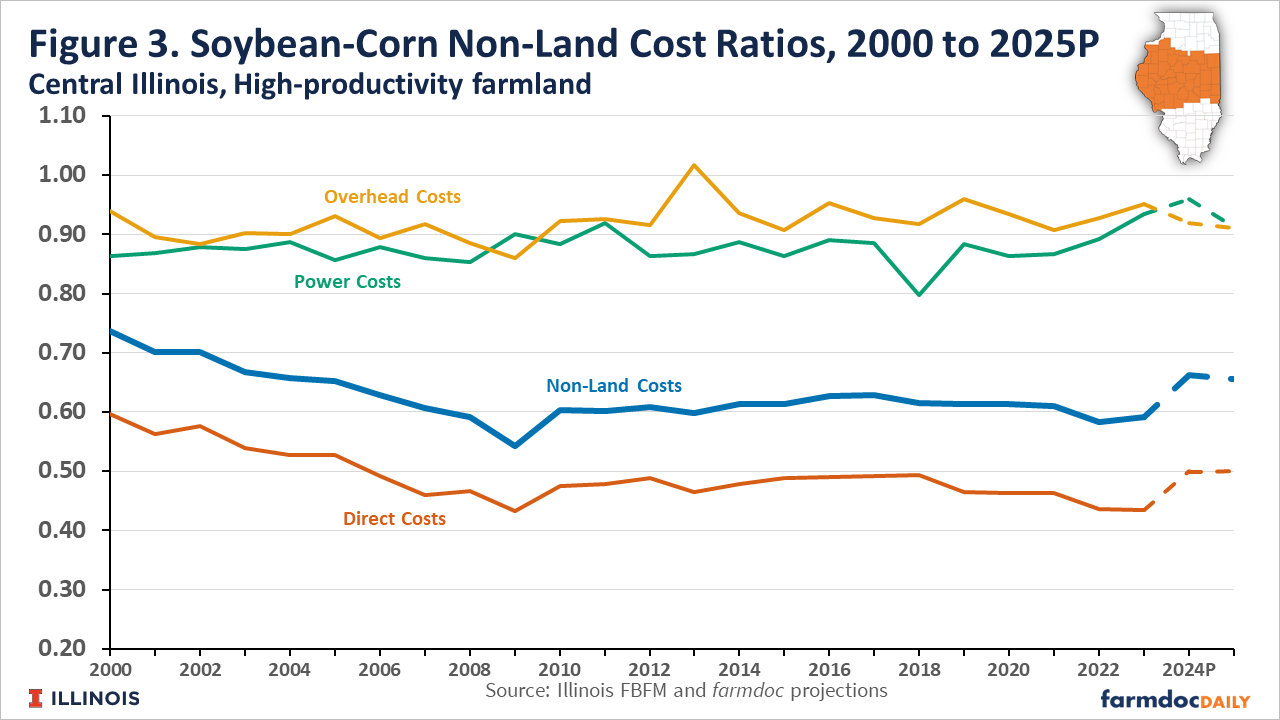
Relative power and overhead costs for soybeans and corn have varied around stable averages over the past 25 years. Power costs include those associated with an operation’s machinery, while overhead includes costs associated with a farm’s labor, buildings, non-land interest, insurance other than crop insurance, and other miscellaneous items.
The decline in relative non-land costs to produce soybeans during the 2000s is driven mainly by the direct cost category. Direct costs include seed, pesticide, and fertility costs as well as costs associated with drying and storage and crop insurance premiums.
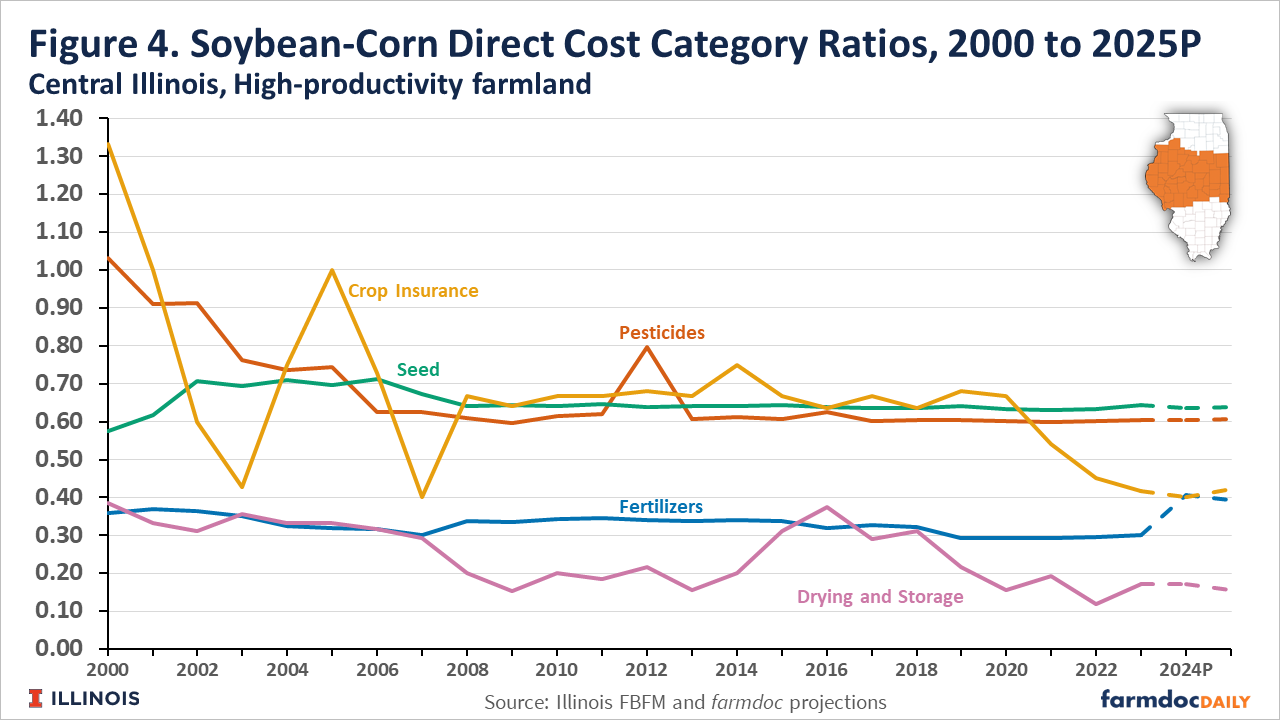
Figure 4 shows soybean to corn cost ratios for the components of direct costs. Relative seed and fertilizer costs for soybeans compared to corn have remained stable since 2000. The relative cost of pesticides decline for soybeans during the 2000s and remained stable since 2010. Relative costs for drying and storage, and for crop insurance, have trended down erratically across the full period shown in Figure 4.
Discussion
The decline in the ratio of breakeven prices for soybeans relative to corn during the 2000s in central Illinois was driven by relative non-land cost advantages for soybeans. The relative cost improvements for soybeans were due mainly to direct inputs, particularly those associated with pesticides. Production costs across categories have increased for both corn and soybeans over time but cost increases have been larger in relative terms for corn.
The ratio of the national marketing year average (MYA) price for soybeans to corn has averaged just over 2.5 since the mid-1970s (see farmdoc daily from March 10, 2021). A general rule of thumb has been that expected price ratios above the long-term average suggest increases in planted acreage of soybeans relative to corn and vice versa.
The decline in the breakeven price ratio for central Illinois illustrates how price ratio indicators may vary by region and through time. The relative improvement in per acre production costs for soybeans has been consistent with relative corn and soybean return experience in central Illinois since 2000, with soybeans having the advantage in more years than corn since 2010 (see farmdoc daily from April 8, 2025). It is also consistent with the relative increase in soybean acres in Illinois that has occurred since 1990 (see farmdoc daily article from March 3, 2025).
Acknowledgement
The authors would like to acknowledge that data used in this study comes from the local Farm Business Farm Management (FBFM) Associations across the State of Illinois. Without their cooperation, information as comprehensive and accurate as this would not be available for educational purposes. FBFM, which consists of 5,000 plus farmers and 68 professional field staff, is a not-for-profit organization available to all farm operators in Illinois. FBFM field staff provide on-farm counsel with computerized recordkeeping, farm financial management, business entity planning and income tax management. For more information, please contact the State FBFM Office located at the University of Illinois Department of Agricultural and Consumer Economics at 217-333-8346 or visit the FBFM website at www.fbfm.org.
References
Paulson, N., G. Schnitkey, C. Zulauf, J. Colussi and J. Baltz. "The Rising Costs of Corn Production in Illinois." farmdoc daily (13):175, Department of Agricultural and Consumer Economics, University of Illinois at Urbana-Champaign, September 26, 2023.
Paulson, N., G. Schnitkey, C. Zulauf and J. Colussi. "The Rising Costs of Soybean Production in Illinois." farmdoc daily (13):208, Department of Agricultural and Consumer Economics, University of Illinois at Urbana-Champaign, November 14, 2023.
Paulson, N., G. Schnitkey, B. Zwilling and C. Zulauf. "Revised 2025 Crop Budgets." farmdoc daily (15):9, Department of Agricultural and Consumer Economics, University of Illinois at Urbana-Champaign, January 14, 2025.
Paulson, N., G. Schnitkey and C. Zulauf. "Projected Corn versus Soybean Returns in Illinois for 2025." farmdoc daily (15):65, Department of Agricultural and Consumer Economics, University of Illinois at Urbana-Champaign, April 8, 2025.
Schnitkey, G., N. Paulson and C. Zulauf. "2022 County Crop Yields." farmdoc daily (13):51, Department of Agricultural and Consumer Economics, University of Illinois at Urbana-Champaign, March 21, 2023.
Zulauf, C. and A. Lines. "Soybean – Corn Ratios Since 1974." farmdoc daily (11):35, Department of Agricultural and Consumer Economics, University of Illinois at Urbana-Champaign, March 10, 2021.
Zulauf, C., J. Coppess, G. Schnitkey and N. Paulson. "US Corn, Soybean, and Wheat Acres in the Planting Flexibility Era." farmdoc daily (15):40, Department of Agricultural and Consumer Economics, University of Illinois at Urbana-Champaign, March 3, 2025.
Disclaimer: We request all readers, electronic media and others follow our citation guidelines when re-posting articles from farmdoc daily. Guidelines are available here. The farmdoc daily website falls under University of Illinois copyright and intellectual property rights. For a detailed statement, please see the University of Illinois Copyright Information and Policies here.