


The Financial Efficiency of Illinois Grain Farms: Examining the Operating Expense Ratio by Farm Size
In our previous article (see farmdoc daily, April 17, 2025), we examined regional trends in the median operating expense ratio for Illinois grain farms over the past two decades. Our analysis showed that, despite grain farms reporting ratios within the strong (<60%) or cautionary (60–80%) performance categories for most of the period, a sharp upward trend in the ratio has emerged across all regions. This shift is primarily attributed to declining gross farm returns coupled with rising operating costs. By 2023, median operating expense ratios had reached vulnerable levels (>80%) in northern and southern Illinois, with central Illinois nearing that threshold—signaling a significant decline in financial efficiency for many grain farms statewide.
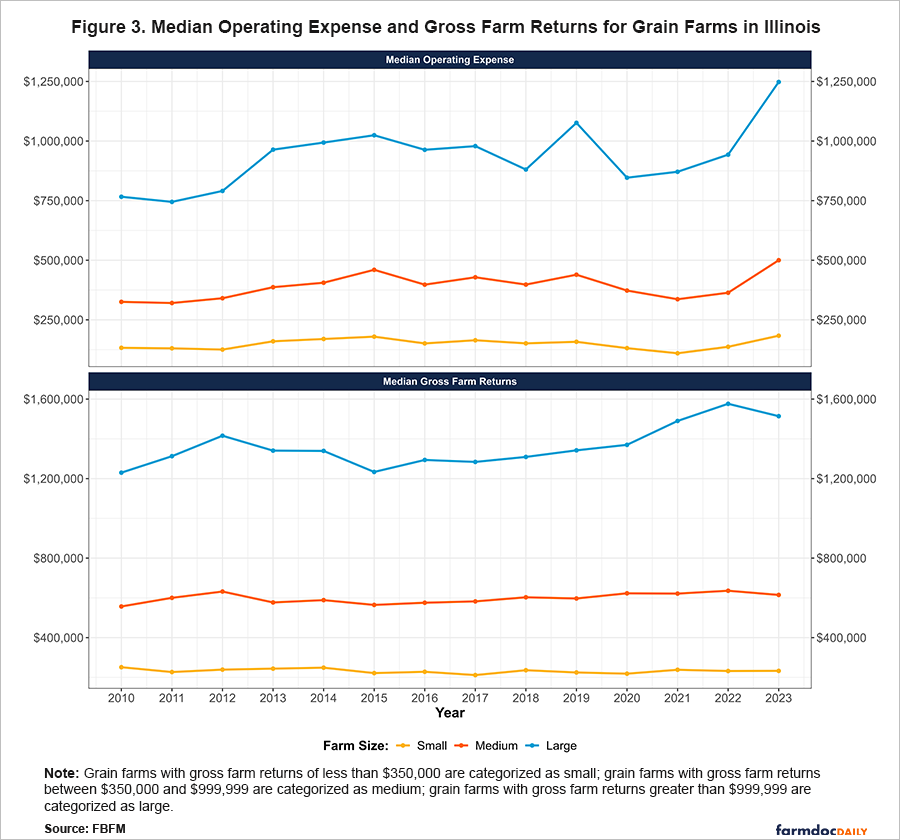
In this article, we extend our analysis by exploring operating expense ratio trends across different farm sizes, using data obtained from the Illinois Farm Business Farm Management (FBFM). This ratio is calculated by dividing total operating expenses (excluding interest and depreciation) by gross farm returns. As a measure of financial efficiency, the ratio represents the share of gross farm revenues used to cover a farm’s day-to-day operating costs. In our analysis, the farm size categories are based on the size of a grain operation’s gross farm returns. Small farms are defined as those with gross farm returns less than $350,000, medium-sized farms have returns between $350,000 and $999,999, while large farms have returns greater than $999,999.
To assess the financial quality of the reported operating expense ratios, we use the Farm Financial Scorecard developed by the Center for Farm Financial Management. A grain farm with an operating expense ratio greater than 80% is considered vulnerable, a ratio between 60% and 80% is cautionary, and a ratio less than 60% is strong.[1] A lower ratio reflects greater financial efficiency, indicating that a larger share of the farm’s income is available for other uses after covering its operating expenditures.
Trends in the Median Operating Expense Ratio
In both panels of Figure 1, we use the color-coding system from the Farm Financial Scorecard to indicate the financial quality of the reported operating expense ratio. The region shaded in red indicates a vulnerable ratio, yellow represents a cautionary ratio, and green indicates a strong ratio. The top panel shows the median operating expense ratio across the three size categories. In the bottom panel of the figure, each year’s data is summarized using box-and-whisker plots, illustrating how spread out the operating expense ratios are across the three farm size categories .[2] The components of the boxplot consist of (1) minimum (lowest value) or 0th percentile, (2) first quartile or 25th percentile, (3) median or 50th percentile, (4) third quartile or 75th percentile, and (5) maximum (highest value) or 100th percentile. The shaded box represents the middle 50% of values—half the data is within it—with its bottom edge marking the first quartile (25% of data falls below this point) and its top edge marking the third quartile (75% of data falls below this point). The thick line inside the box is the median (50th percentile), the exact middle value, where half the data is smaller, and half is larger. The lines (whiskers) extending from the box reach the minimum and maximum values of the data, showing the overall range of the operating expense ratio across grain farms, excluding extreme values.
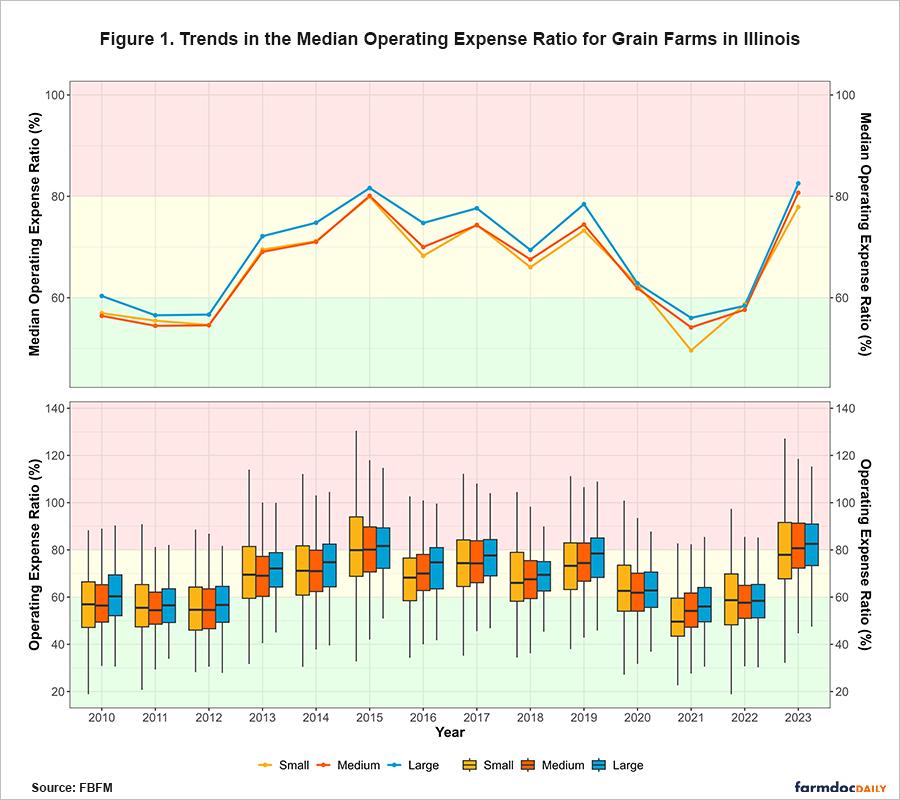
Although the median operating expense ratio generally moved in tandem across the three farm size categories, large grain farms typically reported the highest ratio, as shown in the top panel of Figure 1. In both 2015 and 2023, the ratios for large and medium-sized grain farms reached the vulnerable (> 80%) range. In contrast, small grain farms maintained median ratios within the strong (< 60%) and cautionary (60-80%) ranges throughout the 2010-2023 period.
Beyond the median levels, distributional differences across the size categories are evident, as shown in the bottom panel of Figure 1. Large grain farms tend to report a tighter range of ratios compared to small and medium-sized farms, indicating less variability in their operating expense ratios compared to smaller farms. As a reminder, the shaded boxplots represent the middle 50% of values—half the reported operating expense ratios are within it—with their bottom edges marking the first quartile (25% of the data falls below this point) and the top edges marking the third quartile (75% of the data falls below this point). The lines (whiskers) extending from the top of the boxes represent the 25% of grain farms with the highest ratios, while the whiskers extending from the bottom of the boxes represent the 25% of grain farms with the lowest ratios. Similar to the regional trends discussed in our previous article (see farmdoc daily, April 17, 2025), the operating expense ratio has sharply risen since 2021. In 2023, the majority of medium-sized and large grain farms reported ratios in the vulnerable (>80%) range. From 2021 to 2023, the median ratio increased by 47.5% for large grain farms, 48.9% for medium-sized grain farms, and 57.1% for small grain farms.
A Breakdown of Trends in Cost on Operated Acres
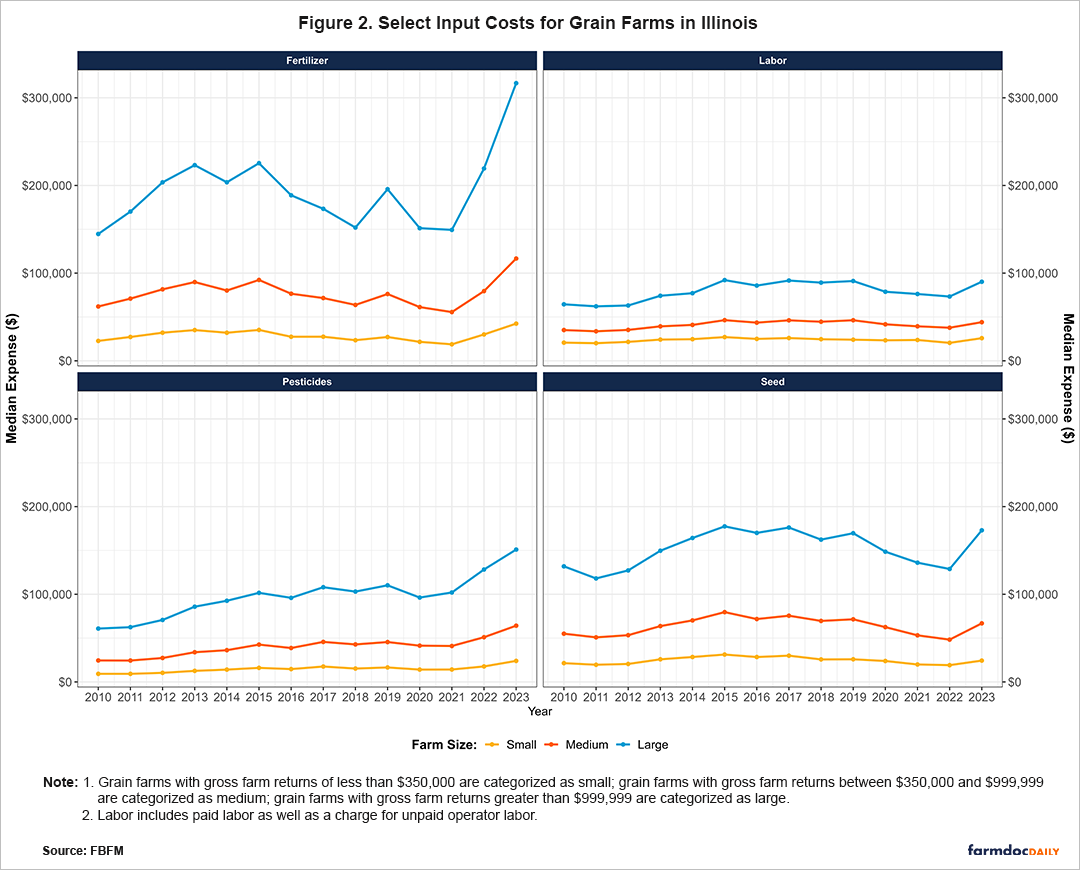
Next, aside from land costs, we briefly discuss trends in some of the largest components of operating expenses. In Figure 2, we present the median costs for fertilizer, pesticides, seed, and labor. These costs are accrual values based on the year the crop was harvested, rather than the year the expenses were paid.[3] As expected, farms with higher gross returns also tend to have higher associated costs for these inputs. Labor costs in Figure 2 include both actual wages paid for farm labor as well as a charge for unpaid operator labor. Among these expenses, pesticide and labor costs have generally shown a gradual upward trend for most of the past 14 years. However, pesticide costs began to increase at a faster rate starting in 2021, while labor costs began to rise faster from 2022. For example, between 2021 and 2023, median pesticide costs increased by 69.3%, 56.5%, and 48.0% for small, medium-sized, and large grain farms, respectively. For labor costs, the increase from 2022 to 2023 was 26.1% for small grain farms, 16.7% for medium-sized, and 23.0% for large grain farms.
In contrast, fertilizer and seed expenses exhibited more variability over time, without the steady increases seen in pesticide and labor costs. Seed costs, in particular, trended downward before 2012, then increased, dipped again until 2022, and rose once more in 2023. The group of farms with the highest gross returns displayed this fluctuation more distinctly and showed a more significant step-up in costs between the medium-sized and large categories compared to the small to medium-sized step-up. Despite this, seed costs tended to follow similar overall patterns across all three size groups. Fertilizer expenses, however, were the most variable and showed more pronounced differences across farm sizes. Large farms experienced more extreme year-over-year changes in fertilizer costs. Fertilizer expenses are also more sensitive to crop type, particularly due to the higher nitrogen requirements of crops like corn and wheat, which are commonly grown in Illinois. Furthermore, larger grain farms typically have more corn acres, thus increasing their need for fertilizer. In percentage terms, median fertilizer costs for large farms have increased by 112.0 % from 2021 to 2023 and by 110.0% for medium-sized farms.
Conclusion
In summary, the median operating expense ratios for Illinois grain farms have increased significantly in recent years across all farm sizes, reflecting a deterioration in financial efficiency. While large farms generally report higher median ratios, the distribution of their reported ratios exhibits less variability than those of smaller operations. Along with declining incomes, rising input costs—such as pesticides, seed, fertilizer, and labor—have contributed to the recent upward trend since 2021.
Acknowledgment
The authors would like to acknowledge that data used in this study comes from the Illinois Farm Business Farm Management (FBFM) Association. Without Illinois FBFM, information as comprehensive and accurate as this would not be available for educational purposes. FBFM, which consists of 5,000+ farmers and 70 professional field staff, is a not-for-profit organization available to all farm operators in Illinois. FBFM field staff provide on-farm counsel along with recordkeeping, farm financial management, business entity planning and income tax management. For more information, please contact our office located on the campus of the University of Illinois in the Department of Agricultural and Consumer Economics at 217-333-8346 or visit the FBFM website at www.fbfm.org.
Notes
[1] The Farm Financial Scorecard adheres to the guidelines set by the Farm Financial Standards Council.
[2] Outliers (extreme values) of the operating expense ratio are not presented in our figure.
[3] An accrual value refers to the value of income or expenses that are recognized when they are earned or incurred, rather than when cash is actually received or paid. This means, for example, that revenue from grain is recorded in the year it is harvested—even if the sale and cash payment occur later—and expenses are matched to the period when the resources are used, not when the bills are paid.
References
Mashange, G. and B. Zwilling. "The Financial Efficiency of Illinois Grain Farms: Operating Expense Ratio by Region." farmdoc daily (15):72, Department of Agricultural and Consumer Economics, University of Illinois at Urbana-Champaign, April 17, 2025.
Appendices
Disclaimer: We request all readers, electronic media and others follow our citation guidelines when re-posting articles from farmdoc daily. Guidelines are available here. The farmdoc daily website falls under University of Illinois copyright and intellectual property rights. For a detailed statement, please see the University of Illinois Copyright Information and Policies here.