


Trends in Non-Real Estate Farm Lending Activity in the First Quarter
In a recent article by the Kansas City Fed (April 24, 2025), farm lending of non-real estate debt at commercial banks in the first quarter of 2025 grew by about 4% from a year ago. This increase was mainly driven by loans for operating expenses, which grew by over 30% for the third consecutive quarter. In this article, we extend their analysis to focus specifically on first-quarter trends in non-real estate farm lending activity between 2015 and 2025, using data from the Federal Reserve System’s Survey of the Terms of Bank Lending to Farmers. Additionally, we will discuss broader trends in non-real estate debt and liquidity within the farm sector using data from the USDA.
Trends in Loan Activity in the First Quarter
The Survey of the Terms of Bank Lending to Farmers collects information on the characteristics of farm loans made by commercial banks. Our analysis focuses on non-real estate loans, particularly those designated for operating expenses. The latter includes loans used primarily to finance short-term needs such as current crop production expenses and the care and feeding of livestock (including poultry).
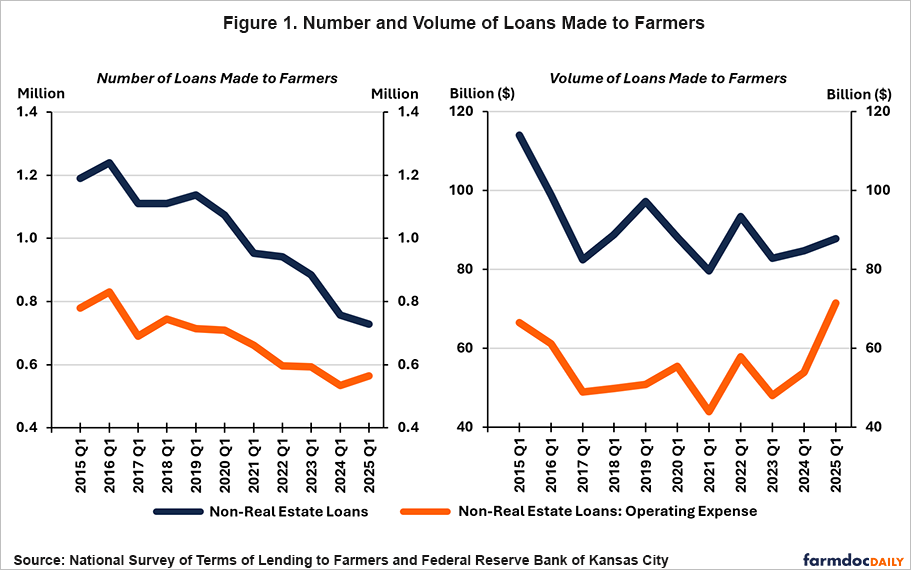
The number of non-real estate loans made to farmers (Figure 1) in the first quarter has trended downward over the past decade. For instance, in Q1 2015, 1.19 million non-real estate loans were originated by commercial banks, with 780 thousand of these being for operating expenses. By Q1 2025, the total number of non-real estate loans made had fallen to approximately 730 thousand, representing a 3.95% decrease from Q1 2024. While the number of loans for operating expenses also decreased over the decade, (from 780 thousand in Q1 2015 to 560 thousand in Q1 2025), this segment of loans grew by 5.66% from the same time last year.
In terms of dollar volume, total non-real estate loans also decreased over the decade (Figure 1), from $114.02 billion in Q1 2015 to $87.83 billion in Q1 2025. However, this total in Q1 2025 represented a 3.68% increase from $84.71 billion in Q1 2024. The volume of agricultural loans for production expenses saw a significant year-over-year increase of 32.64% in Q1 2025, with loan volumes rising from $51.27 billion to $71.57 billion. In Q1 2015, loan volumes for production expenses were $66.60 billion.
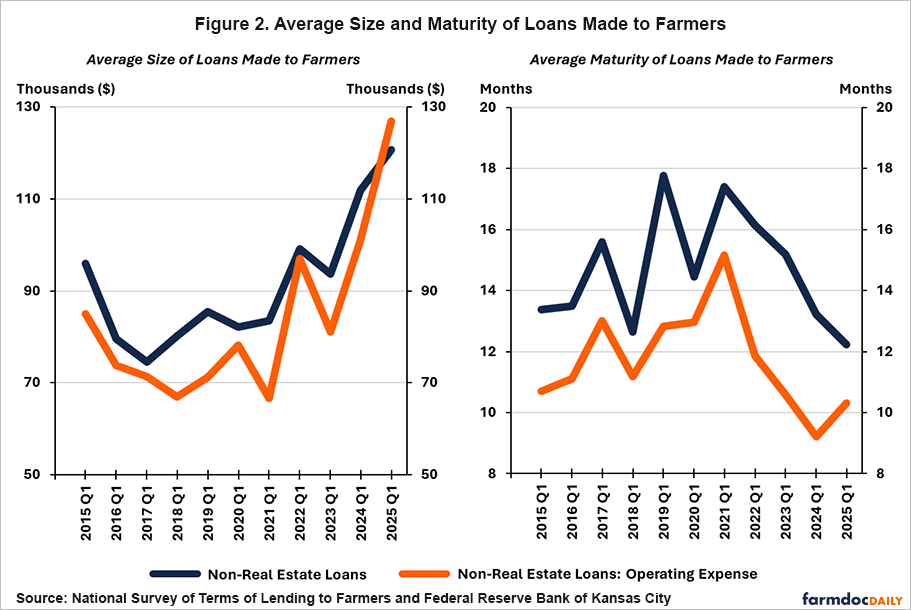
The average size of non-real estate agricultural loans continued its upward trend into the first quarter of the year, as shown in Figure 2. In Q1 2025, the average non-real estate loan was $120.65 thousand, an increase of 7.81% from the previous year. The average size of loans for production expenses experienced an even more substantial growth, rising by 25.45% from $101.16 thousand to $126.91 thousand.
Regarding loan terms, the average maturity of all non-real estate loans has declined since Q1 2021, falling from 17.41 months to 12.22 months by Q1 2025. Similarly, the average maturity for operating expense loans decreased from 15.16 months to 10.31 months. Notably, however, the Q1 2025 value represented a year-over-year increase from 9.20 months in Q1 2024.
The recent loan activity trends discussed above partially reflect the deterioration in liquidity within the farm sector and elevated production costs—issues this article will now briefly discuss.
Farm Sector Non-Real Estate Debt and Working Capital
According to data reported by the ERS, non-real estate debt is projected to increase to $187.60 billion in 2025 as shown in Figure 3. It has been increasing since 2021 ($149.86 billion) and is estimated to have reached $181.80 billion in 2024. This period coincided with a significant rise in production expenses. Total production expenses (including operator dwellings) increased from $371.91 billion in 2021 to $435.75 billion in 2022 (a 17.17% increase), and are estimated to have reached $452.87 billion in 2024—an overall increase of 21.77% from 2021.
Typically, when farms have ample working capital on hand, there is less of a need to borrow in the short-term to cover production expenses. Working capital, defined as current assets minus current liabilities, represents the cash available to fund a farm’s operating expenses after meeting its short-term obligations. Figure 3 illustrates this. For example, from 2016 to 2020, working capital steadily increased while non-real estate debt and production expenses remained relatively level. The farm sector built up working capital substantially in 2021, which grew from $84.75 billion in 2020 to $126.51 billion. It rose again in 2022, reaching $133.23 billion despite a rise in production expenses. In 2023, working capital fell to $132.75 billion and is estimated to have fallen by 6.72% to $123.82 billion in 2024. Looking ahead to 2025, working capital is projected to improve to $128.67 billion, although non-real estate debt is expected to continue its upward trend.
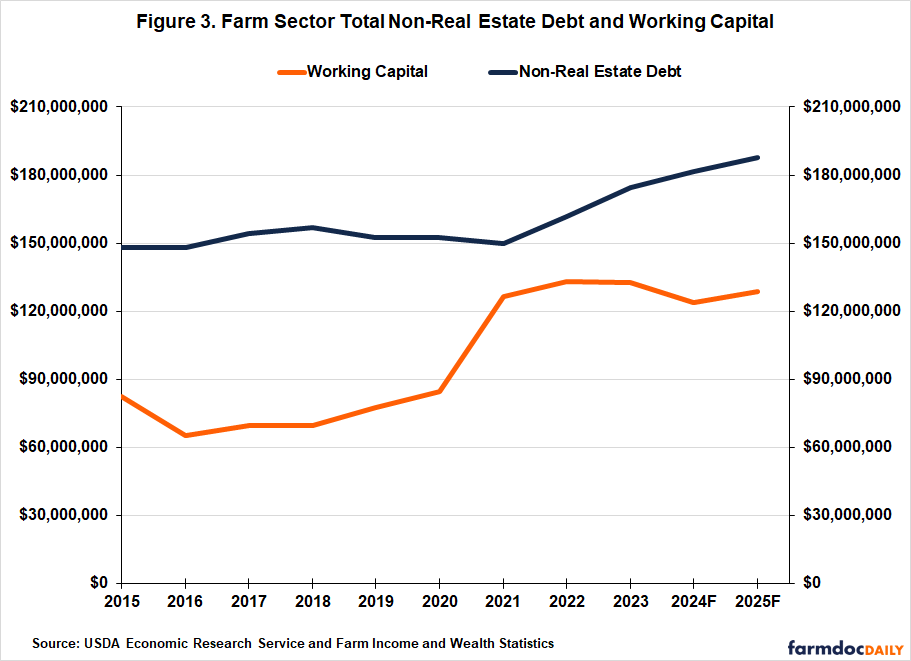
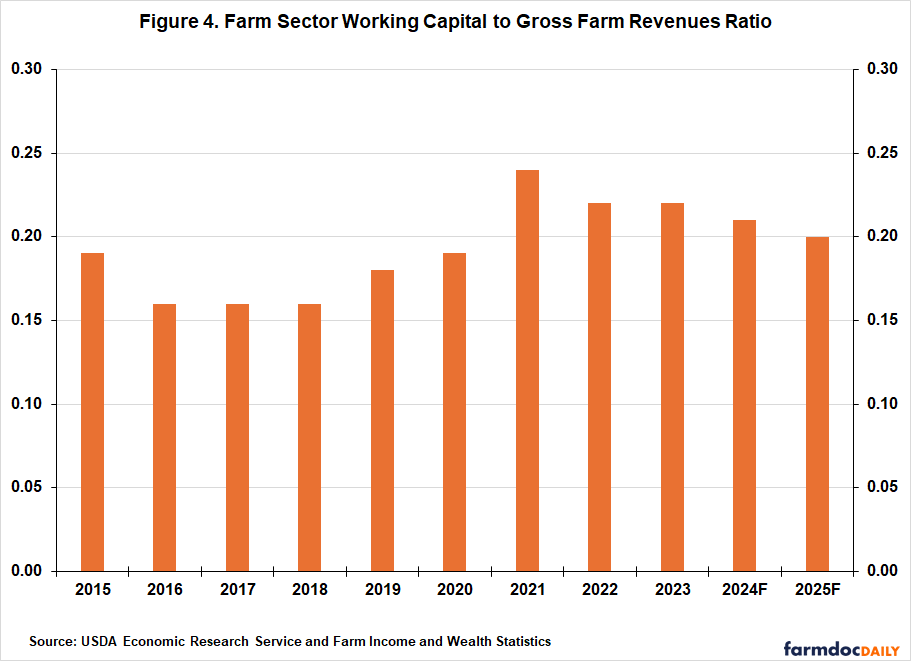
Figure 4 further highlights the recent decline in farm liquidity, as measured by the working capital to gross farm revenue ratio. For this ratio, gross farm revenue is defined as the sum of the value of agricultural sector production and direct Government payments. This ratio represents the amount of available working capital as a percentage of gross farm returns, with a higher ratio indicating a stronger liquidity position. According to the Farm Financial Scorecard, values for this ratio between 10% and 30% are considered to be in the cautionary category. The ratio followed an upward trend, improving from 16% (cautionary) in 2018 before peaking at 24% (cautionary) in 2021. However, it has since declined and is projected by the ERS to reach 20% (cautionary) in 2025.
Conclusion
The recent growth in non-real estate agricultural loan volumes made to farmers by commercial banks coincides with increased production costs and a deterioration in farm sector liquidity. Additionally, although the number of loans originated in the first quarter has trended downward over the past decade, the average size of loans made has increased. Looking ahead, despite the financial headwinds currently faced by farmers in 2025, payments from the American Relief Act are expected to provide some support alongside the anticipated resolution of trade disputes between the U.S. and its trading partners.
References
Kreitman, T. (2025, April 24). “Farm lending increases alongside larger operating loans”. Federal Reserve Bank of Kansas City. https://www.kansascityfed.org/agriculture/agfinance-updates/farm-lending-increases-alongside-larger-operating-loans/
Disclaimer: We request all readers, electronic media and others follow our citation guidelines when re-posting articles from farmdoc daily. Guidelines are available here. The farmdoc daily website falls under University of Illinois copyright and intellectual property rights. For a detailed statement, please see the University of Illinois Copyright Information and Policies here.