


Declining Yield Variability and 2025 US Corn and Soybean Yield Distribution
US corn and soybean yields have deviated notably less from trend yields during the first quarter of the 21st Century than during the last quarter of the 20th Century. The decline is especially large for US corn if the 2012 drought is treated as an outlier event. Percent deviations from trend yield that have occurred so far in the 21st Century imply a 2025 US harvested yield distribution that varies from 142 to 205 for corn and from 43 to 57 for soybeans. Using the percent deviations during the last quarter of the 20th Century, the ranges are 138-210 and 42-59.
Data and Procedures
US corn and soybean yields for the 1974 through 2024 crop years were obtained from the Quickstats database maintained by USDA, NASS (US Department of Agriculture, National Agricultural Statistical Service). Over these 51 years, the linear time trends are:
Corn yield = 85.73 bushel (bu.) / acre+ 1.91 bu. / acre ● (time), where ● = multiply
Soybean yield = 26.80 bu. / acre + 0.51 bu. / acre ● (time)
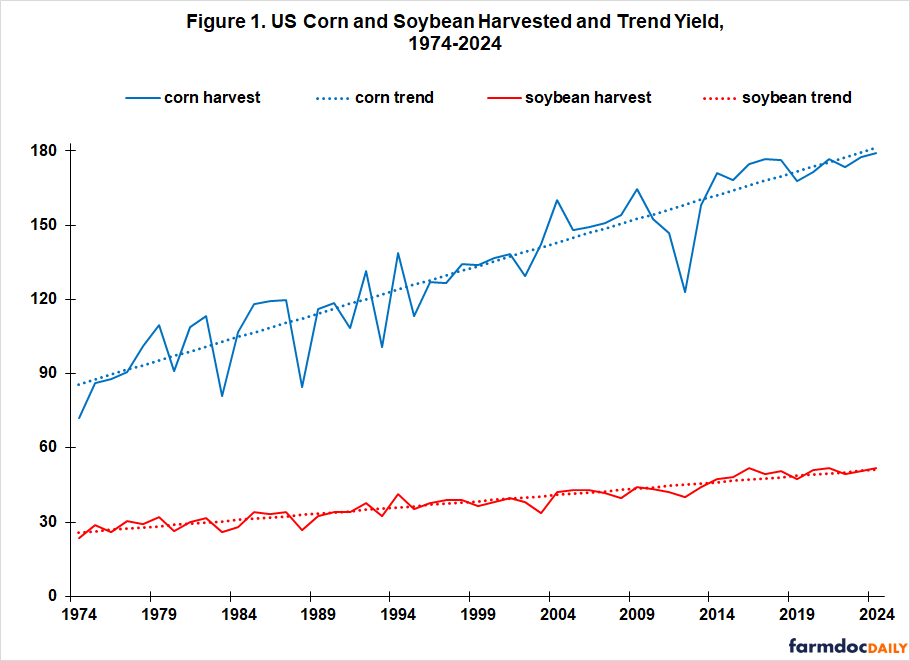
Time is measured as a count variable starting with 0 for 1974 and ending with 50 for 2024. Explanatory power of the linear time trend is 88% for corn and 90% for soybeans. The linear yield trend is 3.76 times larger for US corn than soybeans (1.91 / 0.51). Figure 1 contains the graph of US harvested yield for corn and soybeans over 1974-2024, plus the linear trend yield estimated using the above equations.
The two equations are used to estimate a trend harvested yield for each year from 1974 through 2024. For example, 2024 trend corn yield is 181 (85.73 + 1.91 ● 50). Percent deviation from trend equals (actual yield / trend yield -1). This is -1.0% for 2024 corn (179 / 181 -1). Each year’s percent deviation is multiplied by the projected 2025 trend yield for corn (183) and soybeans (52) from the above equations to derive an estimate of 2025 yields. This procedure results in 51 estimates of US 2025 corn yield and 51 estimates of US 2025 soybean yield.
US. Corn Yield Distribution
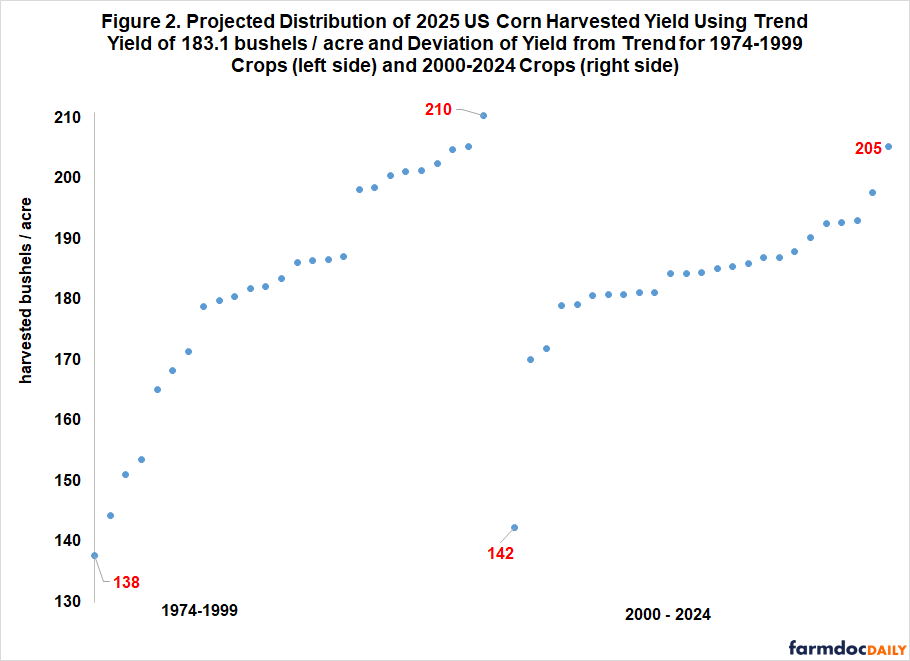
A commonly-used analytical procedure when examining data over time is to divide the time period in half. For 1974-2024, 1999 is the halfway point. The first half (1974-1999) largely coincides with the last quarter of the 20th Century while the second half (2000-2024) largely coincides with the first quarter of the 21st Century. The range of projected yields is 138 to 210 using the percent deviations for 1974-1999 vs. 142 to 205 for 2000-2024 (see Figure 2). For the latter period, its lowest projected yield is associated with the -22% deviation for the 2012 drought. So far, 2012 appears to be a 21st Century outlier. Next lowest deviation from trend is -7%, which occurred for the 2002 corn crop. If 2012 is excluded, the 2025 projected US corn distribution becomes 170 to 205.
Summary statistics were computed to further explore the difference in projected yield variability for the two sub-periods. Figure 3 also contains the same statistics for the entire 1974-2024 period. Standard deviation, a commonly-used measure of variation, is 42% smaller for the distribution derived using percent deviations from trend for 2000-2024 than for 1974-1999. Removing 2012 reduces the standard deviation using 2000-2024 percent deviations to 7.6 bu. per acre, or -61% below the standard deviation using 1974-1999 percent deviations.
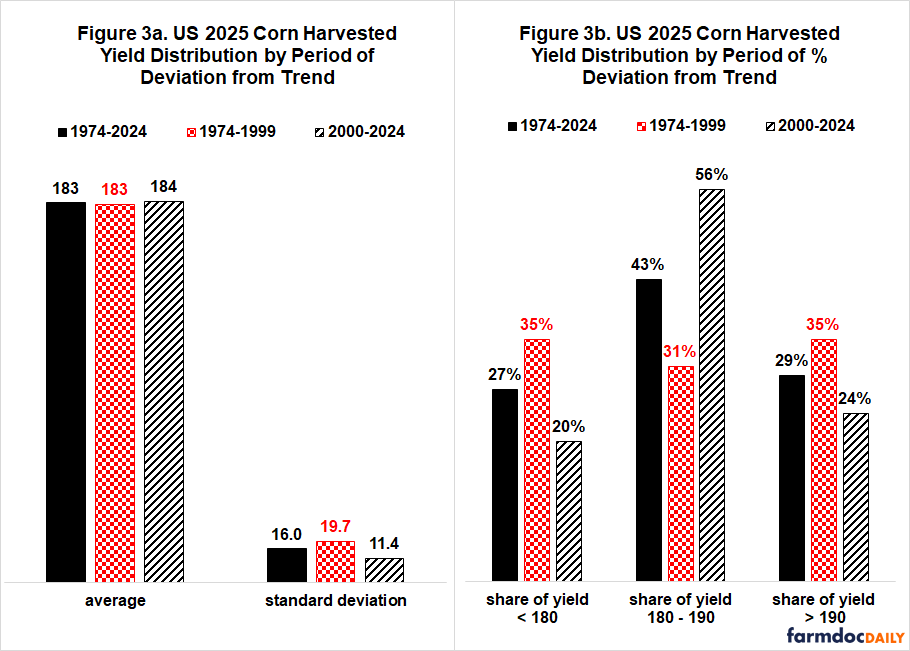
Figure 3b divides the distribution of projected 2025 corn yields into three groups: below 180, 180-190, and above 190. Share of US corn yields between 180 and 190 is 25 percentage points higher using the percent deviations for 2000-2024 than for 1974-1999 (56% – 31%). Share of projected yields below 180 and above 190 both decline by double digits.
US. Soybean Yield Distribution
As with the range of projected 2025 US corn yields, the range of projected 2025 US soybean yields is smaller when using the percent deviations for 2000-2024 than for 1974-1999 (see Figure 4). Lowest projected yield using the percent deviations observed in the 21st Century is associated with the -16% deviation from trend that occurred with the 2003 soybean crop. A gap exists between it and the next lowest yield, but the gap is only -6% (43 / 46 -1) vs. a gap of -16% for corn (142 / 170 -1).
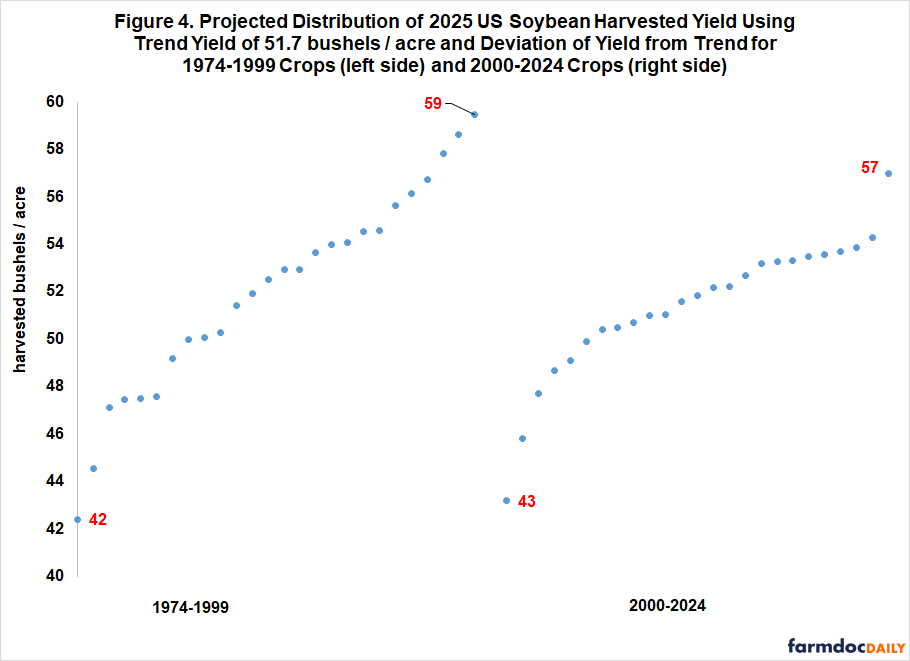
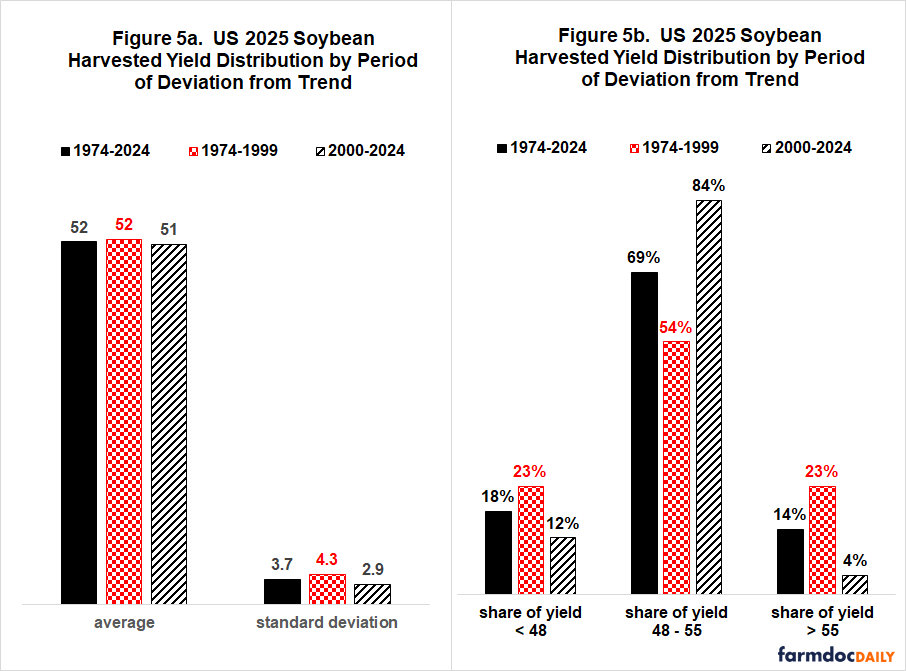
Figure 5 presents the summary statistics for the three projected 2025 US soybean yield distributions. Standard deviation of projected yields is 32% smaller while share of projected US soybean yields between 48 and 55 bu. per acre is 30 percentage point higher when using the percent deviations from the first quarter of the 21st Century than from the last quarter of the 20th Century. Projected yields above 55 bu. are especially fewer using this Century’s percent deviations.
Discussion
Percent deviation from trend yield has been notably smaller during the first quarter of the 21st Century than during the last quarter of the 20th Century, especially for corn if the 2012 drought is considered an outlier event.
The smaller 21st Century percent deviations from trend yield result in a projected range for 2025 harvested yield of 142-205 for corn and 43-57 for soybeans. The larger percent deviations from the last quarter of the 20th Century result in ranges of 138-210 for corn and 42-59 for soybeans. Either set of extreme yields result in very different supply-demand conditions and thus fall 2025 prices.
It remains to be seen if the yield variability of 1974-1999, 2000-2024, or 1974-2024 will be the best indicator of yield variability over the next quarter century. Nevertheless, lower yield variability has profound consequences.
For example, lower yield variability implies that less stocks need to be carried from one crop year to the next. Using data from the Production, Supply, and Distribution data base maintained by USDA, FAS (Foreign Agricultural Service), ending stocks averaged 11% of corn production over 2020-2024 compared to 20% of corn production over 1975-1979. The decline translates into 1.4 billion fewer bushels of corn stocks at 2024 US corn production levels. Yield variability is not the only factor that impacts the level of stocks, but it is likely an important factor.
Declining US corn and soybean yield variability is not consistent with the commonly-told story of increasing yield variability due to climate change. The findings of this study are consistent with the findings in the December 13, 2023 farmdoc daily that yield variability has not increased and likely decreased across the world at the regional level. These two sets of findings do not preclude that climate change may be increasing yield variability, especially in local areas; but they do suggest that adjustment strategies may be offsetting the increasing yield variability impact of climate change, especially at larger geographical areas. The implication is the importance of considering adjustment strategies when examining factors, including climate change that impact changes in crop yields and production.
The findings and selected implications of this study underscore the importance of research to understand the factors impacting crop yield variability. Impacts at the larger geographical areas of nations, regions, and the world are especially not well understood. Increased yield variability at the field or a local area does not necessarily translate into increased yield variability at larger geographical areas.
Weather plays a key role as do genetics (see, for example, Blum and Jordan, and Heisey and Day Rubenstein). However, the role of genetics is often intertwined with changes in farming practices (McFadden, Smith, Wechsler, and Wallander). Anecdotal discussions with farmers suggest chemical control of weeds and insects have been important. The need to verify or reject this hypothesis has become more pressing as consumer and political pressure grows to curtail the availability and use of chemicals.
References
Blum, A. and W. Jordan. 1985. Breeding Crop Varieties for Stress Environments. Critical Reviews in Plant Sciences. Volume 2, Issue 3, pages 199-238.
Heisey, P. and K. Day Rubenstein. 2015. Using Crop Genetic Resources to Help Agriculture Adapt to Climate Change: Economics and Policy. US Department of Agriculture, Economic Research Service. EIB-139.
McFadden, J., D. Smith, S. J. Wechsler, and S. Wallander. 2019. Development, Adoption, and Management of Drought-Tolerant Corn in the United States. US Department of Agriculture, Economic Research Service. EIB-204
US Department of Agriculture, Foreign Agricultural Service. June 2025. Production, Supply, and Distribution Online. https://apps.fas.usda.gov/psdonline/
US Department of Agriculture, National Agricultural Statistics Service. June 2025. Quickstats. http://quickstats.nass.U.S.da.gov/
Zulauf, C., G. Schnitkey, J. Colussi and N. Paulson. "Variability of World and Regional Yields in an Era of Climate Change." farmdoc daily (13):226, Department of Agricultural and Consumer Economics, University of Illinois at Urbana-Champaign, December 13, 2023.
Disclaimer: We request all readers, electronic media and others follow our citation guidelines when re-posting articles from farmdoc daily. Guidelines are available here. The farmdoc daily website falls under University of Illinois copyright and intellectual property rights. For a detailed statement, please see the University of Illinois Copyright Information and Policies here.