


Net Return to Storing US Corn and Soybeans Since 1973
This article extends the October 2, 2025 farmdoc daily on corn and soybean storage cost by evaluating net returns to storing US corn and soybeans since 1973. Cash storage after June is generally not profitable as corn and soybean prices decline on average and in a majority of years. Net return to cash and futures hedged storage ending no later than June does not differ statistically from $0, implying returns just cover total storage cost. This finding nevertheless is consistent with building on-farm storage because on-farm storage provides other opportunities to improve farm profits, such as faster harvest, thus less harvest loss, and more flexible post-harvest marketing, such as location of cash sales. Although not statistically different, cash storage return has been notably higher for soybeans than corn, which is consistent with consumption growing faster for soybeans. Hedged storage offers the advantage of lower net return risk, especially for longer storage periods.
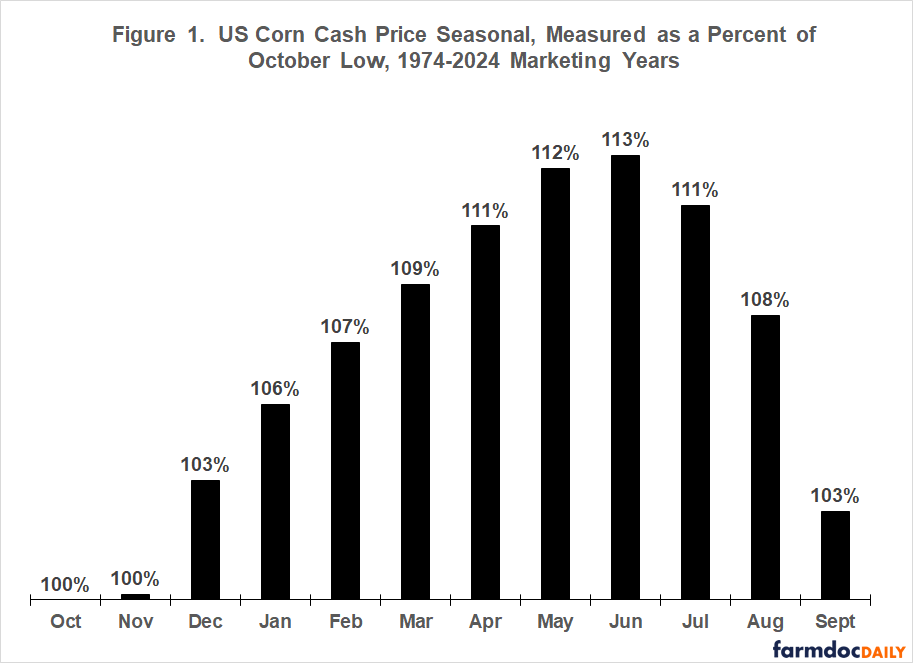
US Corn Price Seasonal
Although US cash corn price since 1973 has averaged nearly the same in October ($2.992) and November ($2.993), October is used as the harvest low price month. The decision in part reflects that October is the harvest low for soybeans (see next section). Average US cash corn price increased through June, peaking at 113% of its October price (see Figure 1). Price increased the most (3 percentage points) from November to December and from December to January. It declined on average after June. Largest decline was from August to September. US cash price was higher in roughly one-third of the years after June, specifically, 39%, 32%, and 32% of the years for July, August, and September, respectively. For a brief discussion of data sources and procedures, see Data Note 1.
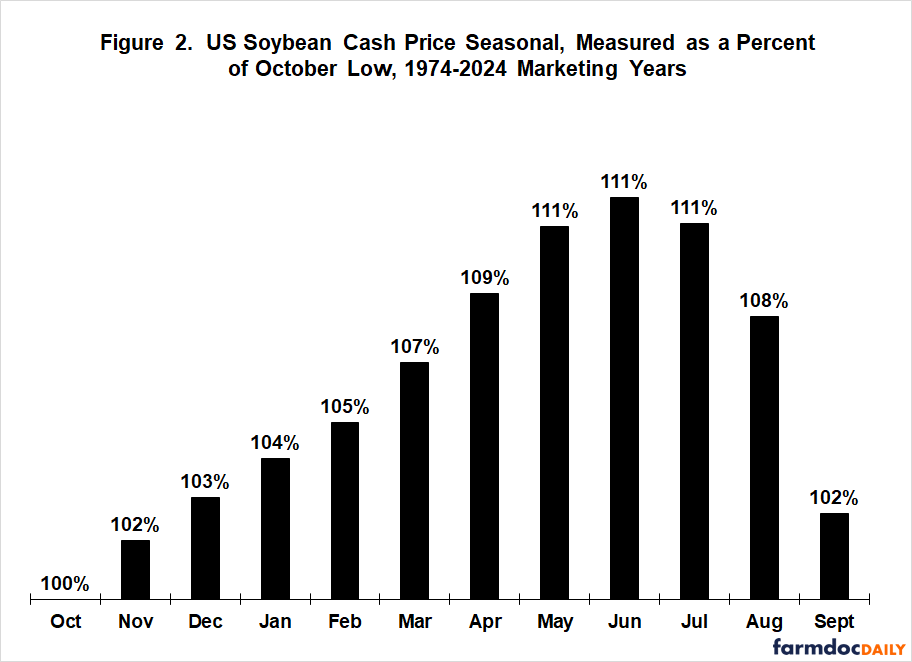
US Soybean Price Seasonal
The cash price seasonals for US soybeans and corn are largely similar (see Figures 2 and 1). Average cash price is highest in June. Largest average decline is from August to September. Soybean cash price did increase more consistently from its October low, specifically one to two percentage points per month through May and had a lower and less defined peak. Average soybean price for May, June, and July all rounded to 111% of the October low (corn’s peak was 113% in June). US soybean’s August and September cash price exceeded its July price in 32% and 28% of the years, respectively.
Net Return to Storing US Corn and Soybeans
Net return to cash storage and storage hedged with futures from October through June is evaluated. These storage strategies are the two most common. October and June have the lowest and highest cash price, respectively. Net cash storage return per bushel equals (a) US cash price for the end-of-storage month (for example, December) minus (b) October US cash price minus (c) interest opportunity cost of storing instead of selling at harvest minus (d) physical storage cost at commercial facilities to keep the crop in useable condition. Net futures hedged storage return per bushel equals (a) net return to cash storage plus (b) change in futures price over the storage period minus (c) cost of trading futures. Since price and storage cost have increased over time, net return is expressed as a percent of the October price. Data Note 2 has more discussion of the procedures and data sources.
Average net return to cash storage expressed relative to the October price does not differ statistically from $0 for both corn and soybeans for all 8 storage periods (see Figure 3). From a statistical perspective, return just covers total cost. While not statistically different, average storage return is higher for soybeans than corn at all storage lengths. In particular, soybean net return exceeds 3% of October price for April, May, and June storage, which may have economic significance.
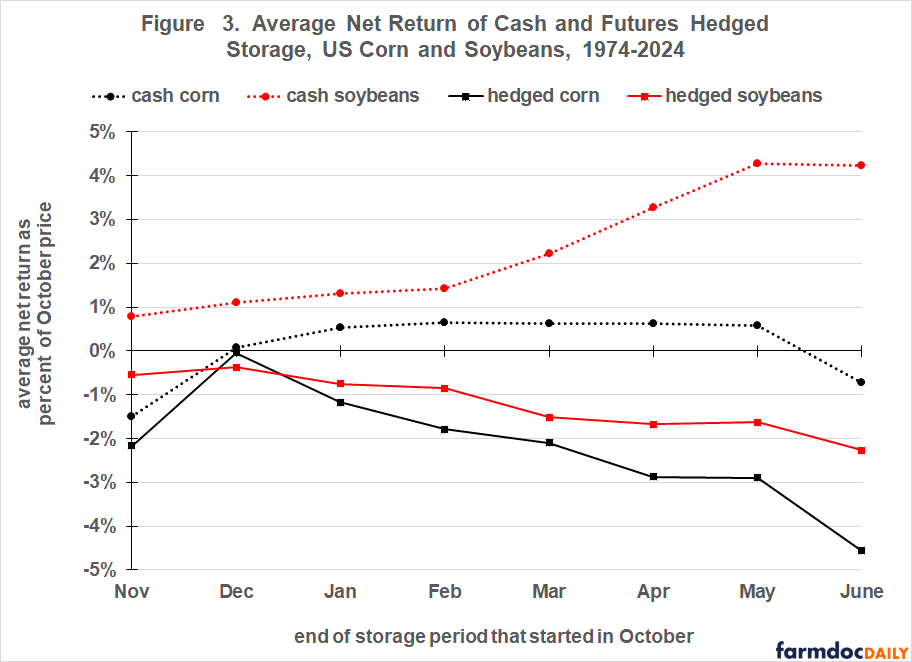
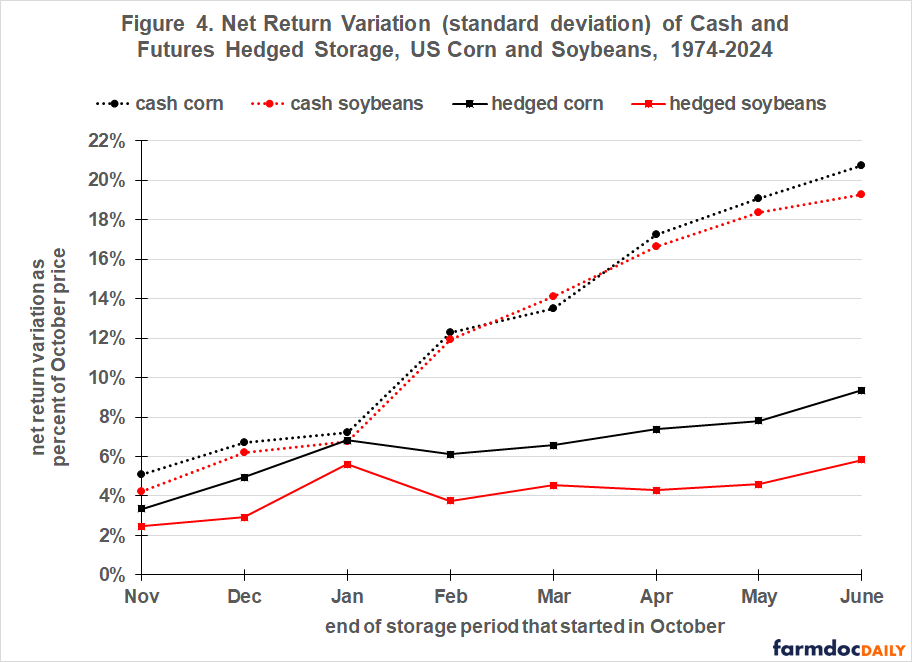
Average net return to futures hedged storage never exceeds $0 for both corn and soybeans (see Figure 4). Moreover, net return is statistically less than $0 with 99% confidence for hedged corn stored to November, April, and June, and for hedged soybeans stored to April and June. The advantage of hedged storage over cash storage is that risk of net return variation is lower. This advantage becomes notable for storage beyond January.
Previous Studies
The net return analysis in this article updates Zulauf and Kim’s analysis published in the Journal of the American Society of Farm Managers and Rural Appraisers and subsequently in a condensed version in farmdoc daily. It covered the 1974-2017 marketing years. Overall patterns of returns and risk are similar, but numerical values differ for some combinations of crop, month, and storage type. Six other studies have also examined returns to storing both corn and soybeans. Five found higher net returns for storing soybeans (Bektemirova, Frechette, Hurt, Kastens and Dhuyvetter, and Johnson). The exception is Paul, but his study only used data prior to 1974. Several of these studies examined cash and hedged storage, all finding less risk for hedged storage. No study has an observation period as long the 51 years in this study. Most have far fewer.
Summary Observations
This study has focused on long term trends and relationships because considerable variation exists across local storage markets in any given year and because storage returns vary notably across years.
Cash storage of corn and soybeans after June is generally not profitable as price declines on average and in a majority of years.
Net return to cash and futures hedged storage of corn and soybeans that ends no later than June does not differ statistically from $0. On average, returns just cover the total cost of storage.
The preceding finding nevertheless is consistent with building on-farm storage since on-farm storage provides other opportunities to improve farm profitability. It allows faster harvest due to longer harvest days plus less travel and wait time in getting a crop stored. Faster harvest can reduce harvest loss due to inclement weather. On-farm storage also provides more flexibility for post-harvest marketing, such as the location of cash sales.
Although not statistically significant, net return to cash storage has been higher for US soybeans than corn. This is consistent with most other studies. The consistency should not be surprising because use has grown faster for soybeans than corn. As price increases to stimulate future production to satisfy increasing future demand, storage is more likely to be profitable.
A clear advantage of hedged storage over cash storage is a lower risk of net return variation, especially for longer storage periods. This finding is well documented in the literature and thus was expected.
The last article in this series will examine if a time trend exists in net storage returns. A time trend would be expected if South America’s long-running growth in corn and soybean production is impacting US storage returns.
Data Notes
- Cash price is the average monthly price paid to US farmers by first handlers as reported by USDA (US Department of Agriculture) National Agricultural Statistics Service. Starting the study with the 1974 marketing year postdates the increase in price variability that occurred in the early 1970s (Kenyon, Jones, and McGuirk). The last complete marketing year is 2024.
- Physical storage cost is from USDA, Commodity Credit Corporation through the 2005 marketing year. Thereafter, it is from an Ohio country elevator, cross checked with another Ohio first delivery point. Opportunity storage cost is measured using the October secondary market six month US Treasury bill rate, discount basis. Six months is the Treasury bill maturity closest to the eight month October-June storage period used in this study. Source is the Federal Reserve Bank of St. Louis. The Chicago July futures contract is used for the storage hedge. It is the first corn and soybean futures contract maturity after June. For each month, the average July futures settlement price is calculated using prices from Barchart.com. Hedge storage cost equals brokerage fee plus liquidity cost for the futures trade. Brokerage fee is assumed to be $50 for a round trip buy and sell of a futures contract based on inquiries of brokers. Liquidity cost arises since the price at which a futures trade is executed usually differs from the price when the trade is placed (execution is not instantaneous). Based on Brorsen, and Thompson and Waller; liquidity cost is $25 per futures trade made before February 1 and $12.50 thereafter. Liquidity cost is less after February 1 because trading volume increases as contract maturity nears. For in-depth discussion of storage and trading cost, see Zulauf and Kim (2020).
References and Data Sources
Barchart.com. 2025. Futures price data. https://www.barchart.com/
Bektemirova, J. 2014. Basis Trading Strategies and Returns to Storage. Theses and Dissertations. http://scholarworks.uark.edu/etd/1013
Brorsen, B. W. 1989. Liquidity Costs and Scalping Returns in the Corn Futures Market. Journal of Futures Markets 9(3): 225-236.
Federal Reserve Bank of St. Louis. September 2025. Federal Reserve Economic Data. https://fred.stlouisfed.org
Frechette, D. L. 1997. The Dynamics of Convenience and the Brazilian Soybean Boom. American Journal of Agricultural Economics 79(November): 1108-1118.
Hurt, C. June 15, 2017. Corn and Soybean Storage in a Wild Decade. Purdue University, Department of Agricultural Economics. PAER-2017-08. http://ag.purdue.edu/commercialag/home/paer-article/corn-and-soybean-storage-returns-in-a-wild-decade/
Kastens, T. L. and K. Dhuyvetter. 1999. Post-harvest Grain Storing and Hedging with Efficient Futures. Journal of Agricultural and Resource Economics 24(2): 482-505.
Kenyon, D., E. Jones, and A. McGuirk. 1993. Forecasting Performance of Corn and Soybean Harvest Futures Contracts. American Journal of Agricultural Economics 75(May): 399-407.
Johnson, S. D. 2017. Does Storing Unpriced Corn and Soybeans Really Pay? Crop Marketing Strategies. Iowa State University Extension and Outreach. November. Volume 11.
Ohio Country Elevator. 2006-2025. Personal inquiry of annual corn and soybean storage rates.
Paul, A. B. 1970. The Pricing of Binspace: A Contribution to the Theory of Storage. American Journal of Agricultural Economics 52(February): 1-12.
Thompson, S. R. and M. L. Waller. 1987. The Execution Cost of Trading in Commodity Futures Markets. Food Research Institute Studies Vol. XX, No. 2: 141-163.
US Department of Agriculture, Commodity Credit Corporation. 1978-2007. Annual personal inquiry.
US Department of Agriculture, National Agricultural Statistics Service. September 2025. QuickStats. http://quickstats.nass.usda.gov/
Zulauf, C., N. Paulson and J. Janzen. “Annual Cost of Storing US Corn and Soybeans Since 1973.” farmdoc daily (15):181, Department of Agricultural and Consumer Economics, University of Illinois at Urbana-Champaign, October 2, 2025.
Zulauf, C. and S. Kim. “Corn vs. Soybean Storage at the US Market Level, 1974-2017.” farmdoc daily (10):163, Department of Agricultural and Consumer Economics, University of Illinois at Urbana-Champaign, September 9, 2020.
Zulauf, C. and S. Kim. 2020. US Market Net Return and Risk to Storing Corn and Soybeans, 1974-2017. Journal of the American Society of Farm Managers and Rural Appraisers. Pages 73-80. https://www.asfmra.org/resources/asfmra-journal
Disclaimer: We request all readers, electronic media and others follow our citation guidelines when re-posting articles from farmdoc daily. Guidelines are available here. The farmdoc daily website falls under University of Illinois copyright and intellectual property rights. For a detailed statement, please see the University of Illinois Copyright Information and Policies here.